

Use the Custom Chart page
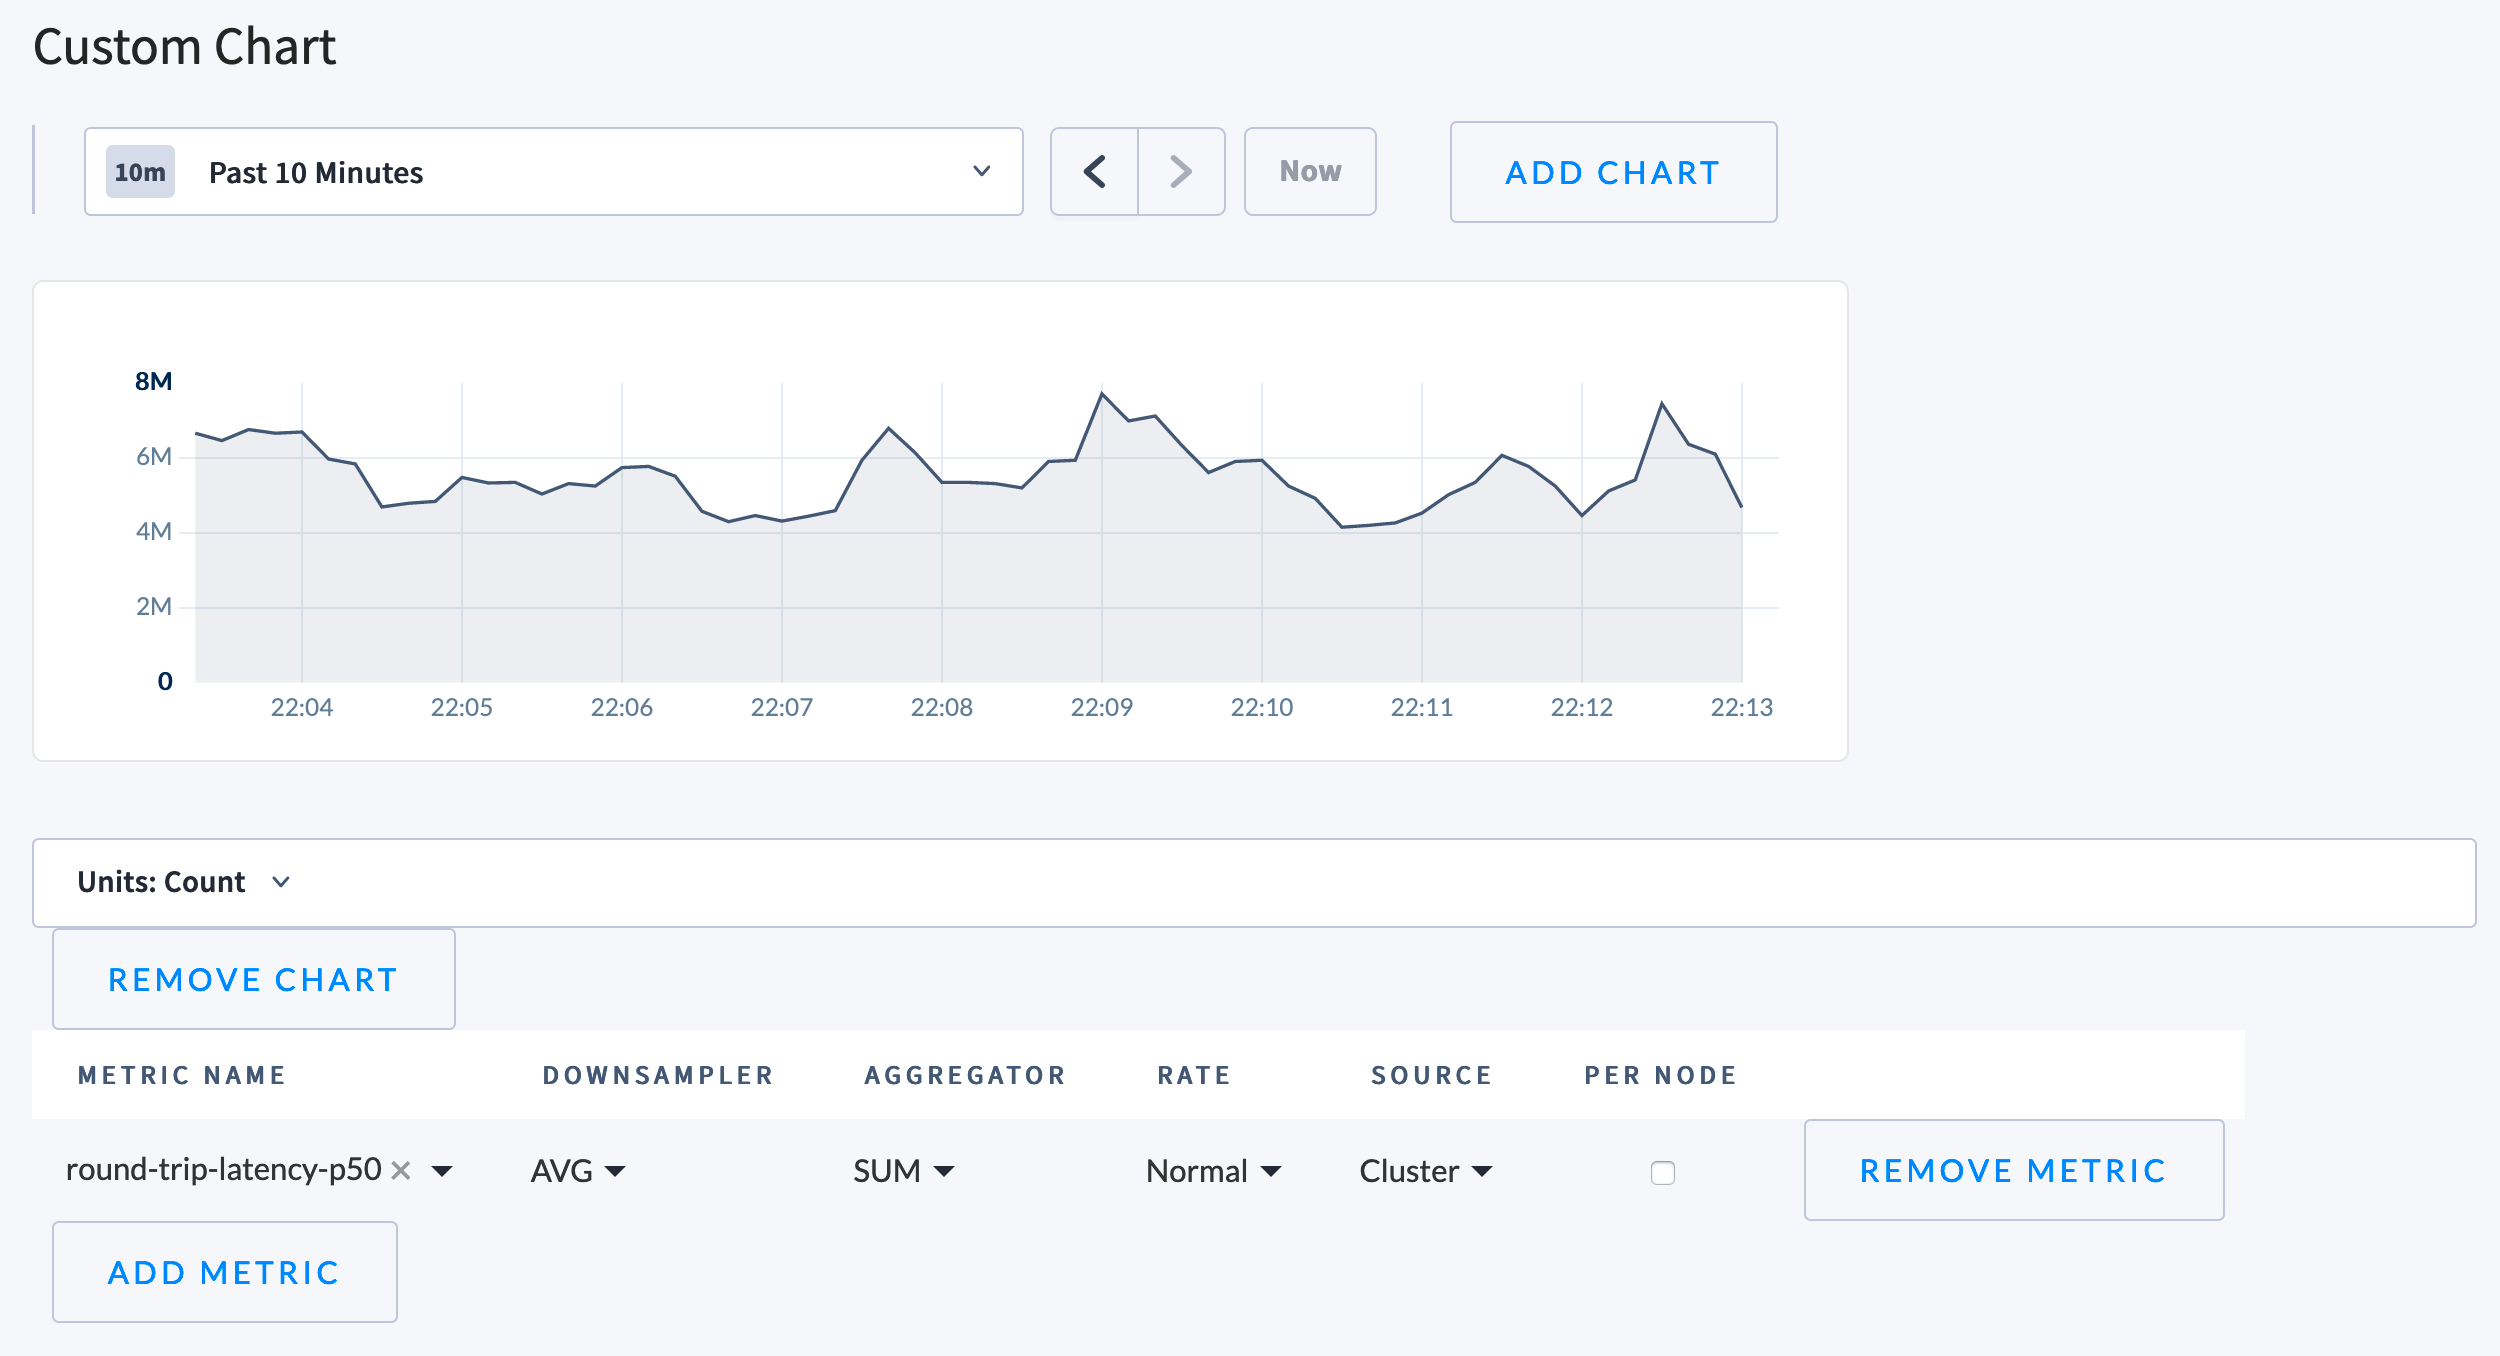
- To set the time span for the page, use the dropdown menu above the charts and select the desired time span. In addition, once you have selected a metric to display, you can drag within the chart itself to a set a custom time range.
- To add a chart, click Add Chart and customize the new chart.
- To customize each chart, use the Units dropdown menu to set the units to display. Then use the table below the chart to select the metrics being queried, and how they’ll be combined and displayed. Options include:
| Column | Description |
|---|---|
| Metric Name | How the system refers to this metric, e.g., sql.bytesin. |
| Downsampler | The “Downsampler” operation is used to combine the individual datapoints over the longer period into a single datapoint. We store one data point every ten seconds, but for queries over long time spans the backend lowers the resolution of the returned data, perhaps only returning one data point for every minute, five minutes, or even an entire hour in the case of the 30 day view. Options:
|
| Aggregator | Used to combine data points from different nodes. It has the same operations available as the Downsampler. Options:
|
| Rate | Determines how to display the rate of change during the selected time period. Options:
|
| Source | The set of nodes being queried, which is either:
|
| Per Node | If checked, the chart will show a line for each node’s value of this metric. |
Examples
Query user and system CPU usage
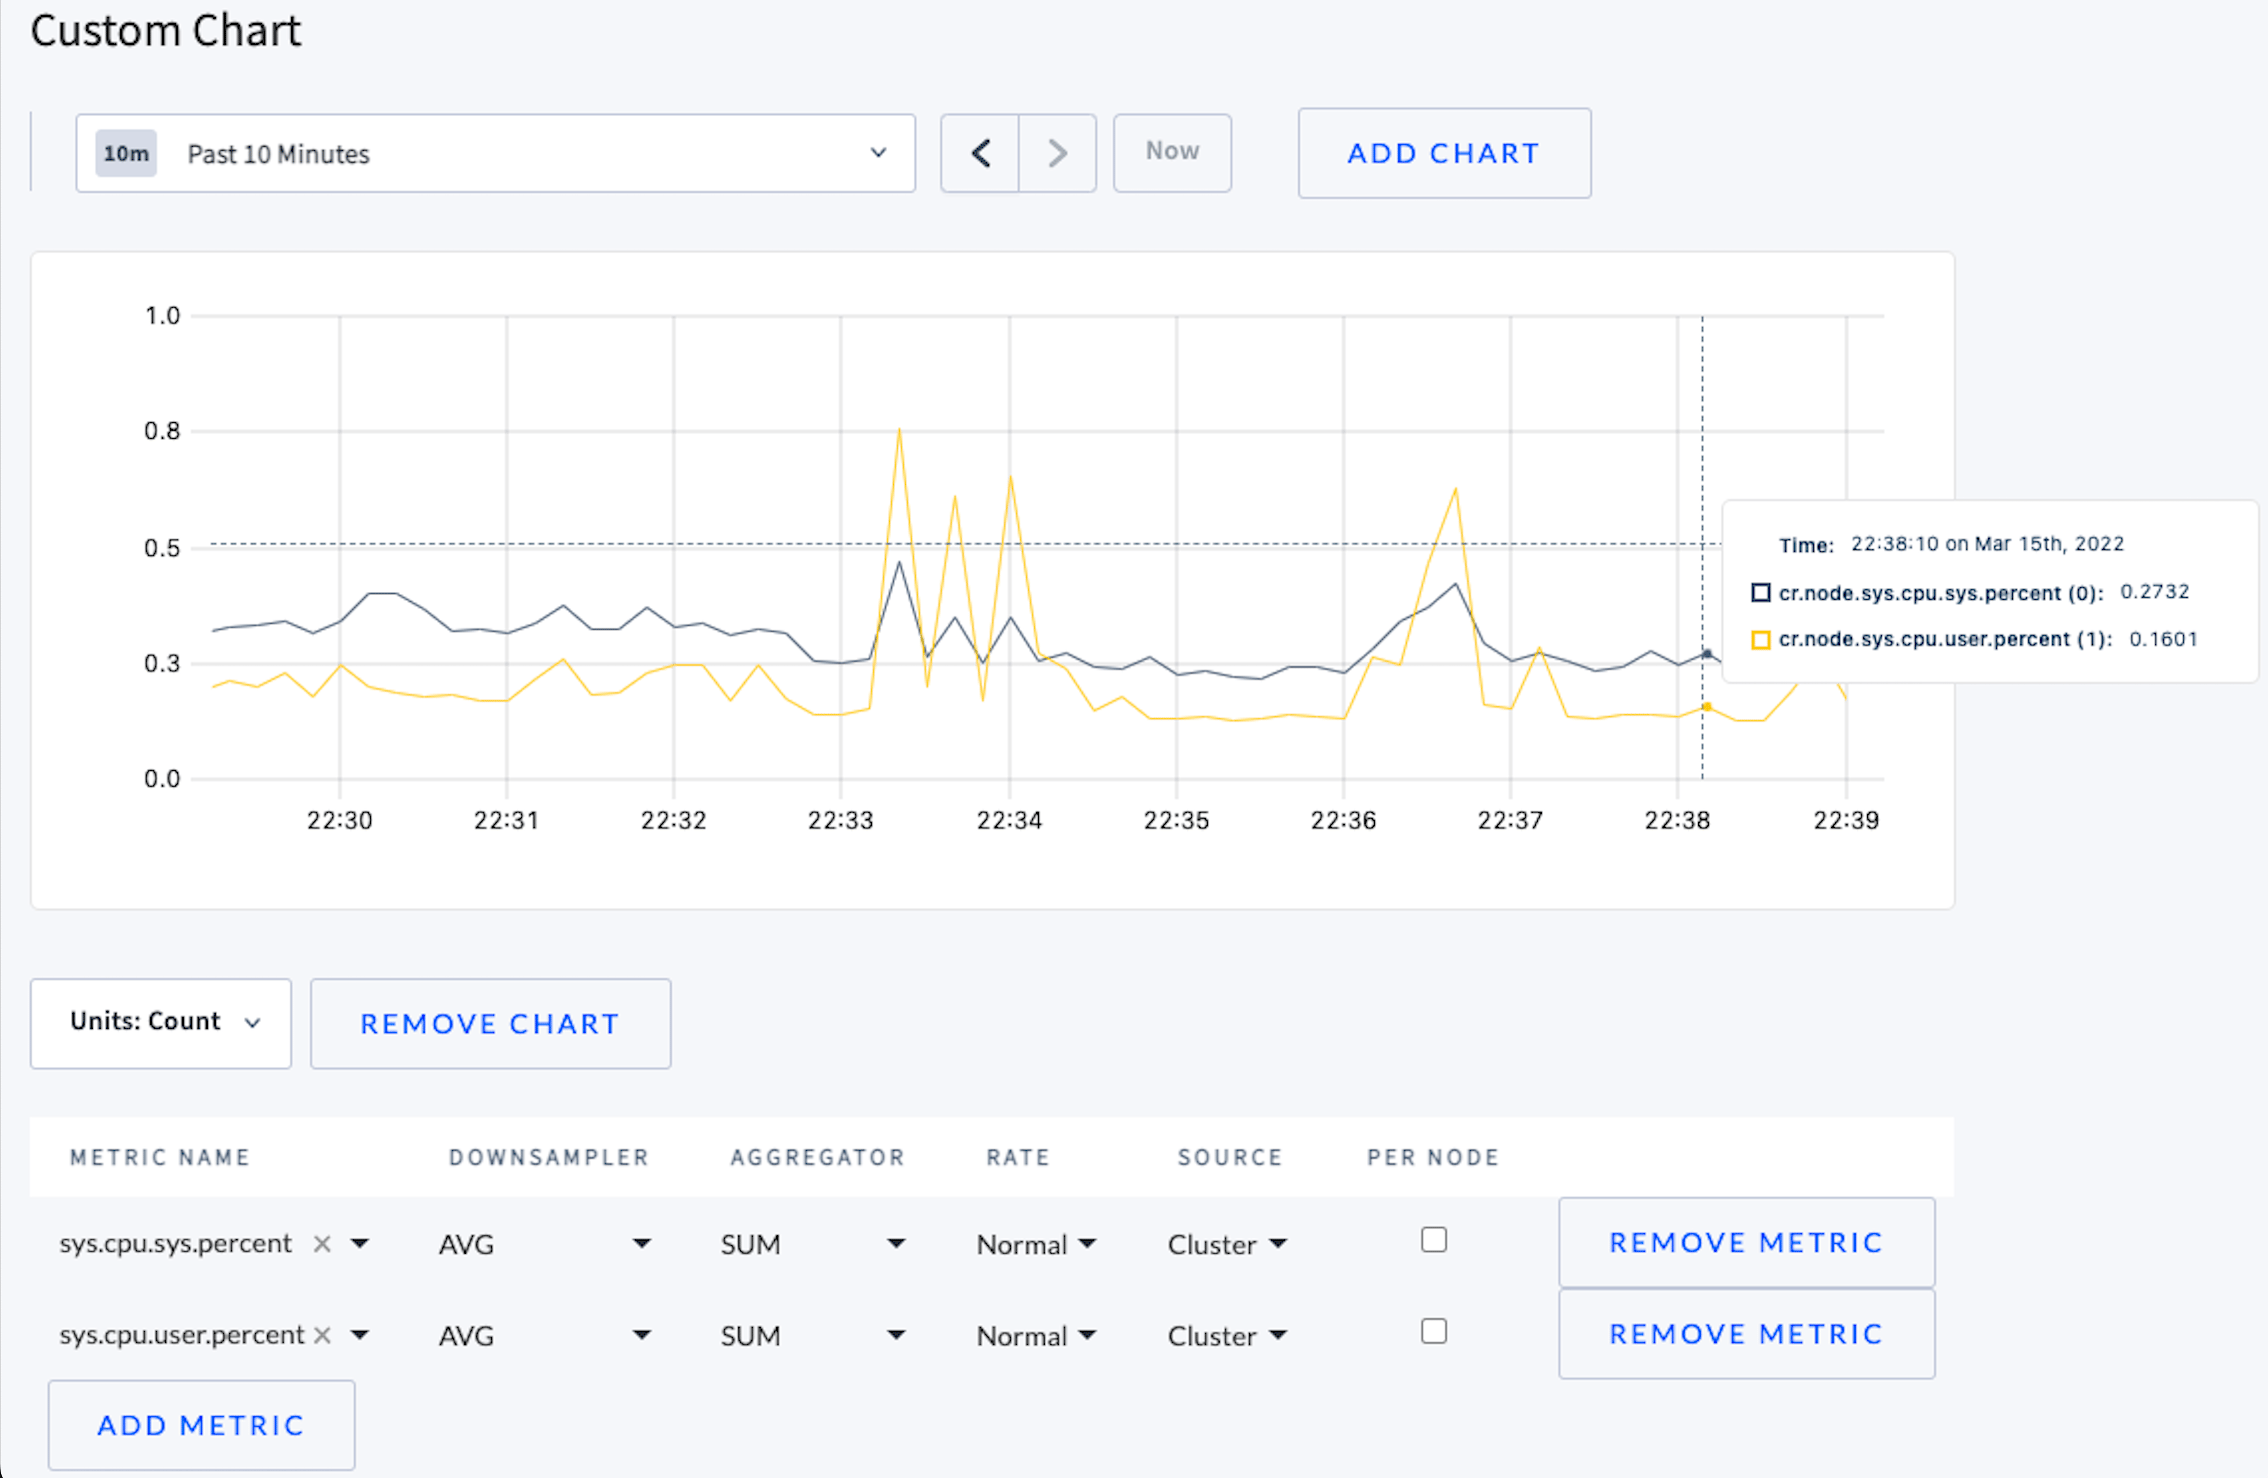
sys.cpu.sys.percentsys.cpu.user.percent
Essential Metrics to Monitor
For important metrics to visualize in a custom dashboard, refer to:Available metrics
Some of the metrics listed below are already visible in other areas of the .
| CockroachDB Metric Name | Description | Type | Unit |
|---|---|---|---|
addsstable.delay.total | Amount by which evaluation of AddSSTable requests was delayed | COUNTER | NANOSECONDS |
addsstable.proposals | Number of SSTable ingestions proposed (i.e. sent to Raft by lease holders) | COUNTER | COUNT |
admission.io.overload | 1-normalized float indicating whether IO admission control considers the store as overloaded with respect to compaction out of L0 (considers sub-level and file counts). | GAUGE | PERCENT |
admission.wait_durations.kv | Wait time durations for requests that waited | HISTOGRAM | NANOSECONDS |
admission.wait_durations.kv-stores | Wait time durations for requests that waited | HISTOGRAM | NANOSECONDS |
auth.cert.conn.latency | Latency to establish and authenticate a SQL connection using certificate | HISTOGRAM | NANOSECONDS |
auth.gss.conn.latency | Latency to establish and authenticate a SQL connection using GSS | HISTOGRAM | NANOSECONDS |
auth.jwt.conn.latency | Latency to establish and authenticate a SQL connection using JWT Token | HISTOGRAM | NANOSECONDS |
auth.ldap.conn.latency | Latency to establish and authenticate a SQL connection using LDAP | HISTOGRAM | NANOSECONDS |
auth.ldap.conn.latency.internal | Internal Auth Latency to establish and authenticate a SQL connection using LDAP(excludes external LDAP calls) | HISTOGRAM | NANOSECONDS |
auth.password.conn.latency | Latency to establish and authenticate a SQL connection using password | HISTOGRAM | NANOSECONDS |
auth.scram.conn.latency | Latency to establish and authenticate a SQL connection using SCRAM | HISTOGRAM | NANOSECONDS |
capacity | Total storage capacity | GAUGE | BYTES |
capacity.available | Available storage capacity | GAUGE | BYTES |
capacity.used | Used storage capacity | GAUGE | BYTES |
changefeed.backfill_count | Number of changefeeds currently executing backfill | GAUGE | COUNT |
changefeed.commit_latency | Event commit latency: a difference between event MVCC timestamp and the time it was acknowledged by the downstream sink. If the sink batches events, then the difference between the oldest event in the batch and acknowledgement is recorded. Excludes latency during backfill. | HISTOGRAM | NANOSECONDS |
changefeed.emitted_bytes | Bytes emitted by all feeds | COUNTER | BYTES |
changefeed.emitted_messages | Messages emitted by all feeds | COUNTER | COUNT |
changefeed.error_retries | Total retryable errors encountered by all changefeeds | COUNTER | COUNT |
changefeed.failures | Total number of changefeed jobs which have failed | COUNTER | COUNT |
changefeed.max_behind_nanos | The most any changefeed’s persisted checkpoint is behind the present | GAUGE | NANOSECONDS |
changefeed.running | Number of currently running changefeeds, including sinkless | GAUGE | COUNT |
clock-offset.meannanos | Mean clock offset with other nodes | GAUGE | NANOSECONDS |
distsender.errors.notleaseholder | Number of NotLeaseHolderErrors encountered from replica-addressed RPCs | COUNTER | COUNT |
distsender.rpc.sent.nextreplicaerror | Number of replica-addressed RPCs sent due to per-replica errors | COUNTER | COUNT |
exec.latency | Latency of batch KV requests (including errors) executed on this node. This measures requests already addressed to a single replica, from the moment at which they arrive at the internal gRPC endpoint to the moment at which the response (or an error) is returned. This latency includes in particular commit waits, conflict resolution and replication, and end-users can easily produce high measurements via long-running transactions that conflict with foreground traffic. This metric thus does not provide a good signal for understanding the health of the KV layer. | HISTOGRAM | NANOSECONDS |
go.scheduler_latency | Go scheduling latency | HISTOGRAM | NANOSECONDS |
intentcount | Count of intent keys | GAUGE | COUNT |
jobs.auto_create_partial_stats.currently_paused | Number of auto_create_partial_stats jobs currently considered Paused | GAUGE | COUNT |
jobs.auto_create_partial_stats.currently_running | Number of auto_create_partial_stats jobs currently running in Resume or OnFailOrCancel state | GAUGE | COUNT |
jobs.auto_create_partial_stats.resume_failed | Number of auto_create_partial_stats jobs which failed with a non-retriable error | COUNTER | COUNT |
jobs.auto_create_stats.currently_paused | Number of auto_create_stats jobs currently considered Paused | GAUGE | COUNT |
jobs.auto_create_stats.currently_running | Number of auto_create_stats jobs currently running in Resume or OnFailOrCancel state | GAUGE | COUNT |
jobs.auto_create_stats.resume_failed | Number of auto_create_stats jobs which failed with a non-retriable error | COUNTER | COUNT |
jobs.backup.currently_paused | Number of backup jobs currently considered Paused | GAUGE | COUNT |
jobs.backup.currently_running | Number of backup jobs currently running in Resume or OnFailOrCancel state | GAUGE | COUNT |
jobs.changefeed.currently_paused | Number of changefeed jobs currently considered Paused | GAUGE | COUNT |
jobs.changefeed.protected_age_sec | The age of the oldest PTS record protected by changefeed jobs | GAUGE | SECONDS |
jobs.create_stats.currently_running | Number of create_stats jobs currently running in Resume or OnFailOrCancel state | GAUGE | COUNT |
jobs.row_level_ttl.currently_paused | Number of row_level_ttl jobs currently considered Paused | GAUGE | COUNT |
jobs.row_level_ttl.currently_running | Number of row_level_ttl jobs currently running in Resume or OnFailOrCancel state | GAUGE | COUNT |
jobs.row_level_ttl.delete_duration | Duration for delete requests during row level TTL. | HISTOGRAM | NANOSECONDS |
jobs.row_level_ttl.num_active_spans | Number of active spans the TTL job is deleting from. | GAUGE | COUNT |
jobs.row_level_ttl.resume_completed | Number of row_level_ttl jobs which successfully resumed to completion | COUNTER | COUNT |
jobs.row_level_ttl.resume_failed | Number of row_level_ttl jobs which failed with a non-retriable error | COUNTER | COUNT |
jobs.row_level_ttl.rows_deleted | Number of rows deleted by the row level TTL job. | COUNTER | COUNT |
jobs.row_level_ttl.rows_selected | Number of rows selected for deletion by the row level TTL job. | COUNTER | COUNT |
jobs.row_level_ttl.select_duration | Duration for select requests during row level TTL. | HISTOGRAM | NANOSECONDS |
jobs.row_level_ttl.span_total_duration | Duration for processing a span during row level TTL. | HISTOGRAM | NANOSECONDS |
jobs.row_level_ttl.total_expired_rows | Approximate number of rows that have expired the TTL on the TTL table. | GAUGE | COUNT |
jobs.row_level_ttl.total_rows | Approximate number of rows on the TTL table. | GAUGE | COUNT |
kv.concurrency.locks | Number of active locks held in lock tables. Does not include replicated locks (intents) that are not held in memory | GAUGE | COUNT |
kv.rangefeed.catchup_scan_nanos | Time spent in RangeFeed catchup scan | COUNTER | NANOSECONDS |
leases.epoch | Number of replica leaseholders using epoch-based leases | GAUGE | COUNT |
leases.expiration | Number of replica leaseholders using expiration-based leases | GAUGE | COUNT |
leases.leader | Number of replica leaseholders using leader leases | GAUGE | COUNT |
leases.liveness | Number of replica leaseholders for the liveness range(s) | GAUGE | COUNT |
leases.transfers.error | Number of failed lease transfers | COUNTER | COUNT |
leases.transfers.success | Number of successful lease transfers | COUNTER | COUNT |
livebytes | Number of bytes of live data (keys plus values) | GAUGE | BYTES |
liveness.heartbeatfailures | Number of failed node liveness heartbeats from this node | COUNTER | COUNT |
liveness.heartbeatlatency | Node liveness heartbeat latency | HISTOGRAM | NANOSECONDS |
liveness.livenodes | Number of live nodes in the cluster (will be 0 if this node is not itself live) | GAUGE | COUNT |
logical_replication.commit_latency | Event commit latency: a difference between event MVCC timestamp and the time it was flushed into disk. If we batch events, then the difference between the oldest event in the batch and flush is recorded | HISTOGRAM | NANOSECONDS |
logical_replication.events_dlqed | Row update events sent to DLQ | COUNTER | COUNT |
logical_replication.events_ingested | Events ingested by all replication jobs | COUNTER | COUNT |
logical_replication.logical_bytes | Logical bytes (sum of keys + values) received by all replication jobs | COUNTER | BYTES |
logical_replication.replicated_time_seconds | The replicated time of the logical replication stream in seconds since the unix epoch. | GAUGE | SECONDS |
physical_replication.logical_bytes | Logical bytes (sum of keys + values) ingested by all replication jobs | COUNTER | BYTES |
physical_replication.replicated_time_seconds | The replicated time of the physical replication stream in seconds since the unix epoch. | GAUGE | SECONDS |
queue.gc.pending | Number of pending replicas in the MVCC GC queue | GAUGE | COUNT |
queue.gc.process.failure | Number of replicas which failed processing in the MVCC GC queue | COUNTER | COUNT |
queue.lease.pending | Number of pending replicas in the replica lease queue | GAUGE | COUNT |
queue.merge.pending | Number of pending replicas in the merge queue | GAUGE | COUNT |
queue.merge.process.failure | Number of replicas which failed processing in the merge queue | COUNTER | COUNT |
queue.merge.process.success | Number of replicas successfully processed by the merge queue | COUNTER | COUNT |
queue.merge.processingnanos | Nanoseconds spent processing replicas in the merge queue | COUNTER | NANOSECONDS |
queue.raftlog.pending | Number of pending replicas in the Raft log queue | GAUGE | COUNT |
queue.raftlog.process.failure | Number of replicas which failed processing in the Raft log queue | COUNTER | COUNT |
queue.raftlog.process.success | Number of replicas successfully processed by the Raft log queue | COUNTER | COUNT |
queue.raftlog.processingnanos | Nanoseconds spent processing replicas in the Raft log queue | COUNTER | NANOSECONDS |
queue.replicagc.pending | Number of pending replicas in the replica GC queue | GAUGE | COUNT |
queue.replicagc.process.failure | Number of replicas which failed processing in the replica GC queue | COUNTER | COUNT |
queue.replicagc.process.success | Number of replicas successfully processed by the replica GC queue | COUNTER | COUNT |
queue.replicate.pending | Number of pending replicas in the replicate queue | GAUGE | COUNT |
queue.replicate.process.failure | Number of replicas which failed processing in the replicate queue | COUNTER | COUNT |
queue.replicate.process.success | Number of replicas successfully processed by the replicate queue | COUNTER | COUNT |
queue.replicate.replacedecommissioningreplica.error | Number of failed decommissioning replica replacements processed by the replicate queue | COUNTER | COUNT |
raft.scheduler.latency | Queueing durations for ranges waiting to be processed by the Raft scheduler. This histogram measures the delay from when a range is registered with the scheduler for processing to when it is actually processed. This does not include the duration of processing. | HISTOGRAM | NANOSECONDS |
raftlog.behind | Number of Raft log entries followers on other stores are behind. This gauge provides a view of the aggregate number of log entries the Raft leaders on this node think the followers are behind. Since a raft leader may not always have a good estimate for this information for all of its followers, and since followers are expected to be behind (when they are not required as part of a quorum) *and* the aggregate thus scales like the count of such followers, it is difficult to meaningfully interpret this metric. | GAUGE | COUNT |
range.adds | Number of range additions | COUNTER | COUNT |
range.merges | Number of range merges | COUNTER | COUNT |
range.snapshots.send-queue | Number of snapshots queued to send | GAUGE | COUNT |
range.splits | Number of range splits | COUNTER | COUNT |
ranges | Number of ranges | GAUGE | COUNT |
ranges.decommissioning | Number of ranges with at lease one replica on a decommissioning node | GAUGE | COUNT |
| Number of ranges with fewer live replicas than needed for quorum | GAUGE | COUNT | |
ranges.underreplicated | Number of ranges with fewer live replicas than the replication target | GAUGE | COUNT |
rebalancing.cpunanospersecond | Average CPU nanoseconds spent on processing replica operations in the last 30 minutes. | GAUGE | NANOSECONDS |
rebalancing.lease.transfers | Number of lease transfers motivated by store-level load imbalances | COUNTER | COUNT |
rebalancing.queriespersecond | Number of kv-level requests received per second by the store, considering the last 30 minutes, as used in rebalancing decisions. | GAUGE | COUNT |
rebalancing.range.rebalances | Number of range rebalance operations motivated by store-level load imbalances | COUNTER | COUNT |
rebalancing.replicas.cpunanospersecond | Histogram of average CPU nanoseconds spent on processing replica operations in the last 30 minutes. | HISTOGRAM | NANOSECONDS |
rebalancing.replicas.queriespersecond | Histogram of average kv-level requests received per second by replicas on the store in the last 30 minutes. | HISTOGRAM | COUNT |
replicas | Number of replicas | GAUGE | COUNT |
replicas.leaseholders | Number of lease holders | GAUGE | COUNT |
requests.slow.latch | Number of requests that have been stuck for a long time acquiring latches. Latches moderate access to the KV keyspace for the purpose of evaluating and replicating commands. A slow latch acquisition attempt is often caused by another request holding and not releasing its latches in a timely manner. This in turn can either be caused by a long delay in evaluation (for example, under severe system overload) or by delays at the replication layer. This gauge registering a nonzero value usually indicates a serious problem and should be investigated. | GAUGE | COUNT |
requests.slow.lease | Number of requests that have been stuck for a long time acquiring a lease. This gauge registering a nonzero value usually indicates range or replica unavailability, and should be investigated. In the common case, we also expect to see ‘requests.slow.raft’ to register a nonzero value, indicating that the lease requests are not getting a timely response from the replication layer. | GAUGE | COUNT |
requests.slow.raft | Number of requests that have been stuck for a long time in the replication layer. An (evaluated) request has to pass through the replication layer, notably the quota pool and raft. If it fails to do so within a highly permissive duration, the gauge is incremented (and decremented again once the request is either applied or returns an error). A nonzero value indicates range or replica unavailability, and should be investigated. | GAUGE | COUNT |
rocksdb.block.cache.hits | Count of block cache hits | COUNTER | COUNT |
rocksdb.block.cache.misses | Count of block cache misses | COUNTER | COUNT |
rocksdb.compactions | Number of table compactions | COUNTER | COUNT |
rocksdb.read-amplification | Number of disk reads per query | GAUGE | CONST |
round-trip-latency | Distribution of round-trip latencies with other nodes. This only reflects successful heartbeats and measures gRPC overhead as well as possible head-of-line blocking. Elevated values in this metric may hint at network issues and/or saturation, but they are no proof of them. CPU overload can similarly elevate this metric. The operator should look towards OS-level metrics such as packet loss, retransmits, etc, to conclusively diagnose network issues. Heartbeats are not very frequent (~seconds), so they may not capture rare or short-lived degradations. | HISTOGRAM | NANOSECONDS |
rpc.connection.avg_round_trip_latency | Sum of exponentially weighted moving average of round-trip latencies, as measured through a gRPC RPC. Since this metric is based on gRPC RPCs, it is affected by application-level processing delays and CPU overload effects. See rpc.connection.tcp_rtt for a metric that is obtained from the kernel’s TCP stack. Dividing this Gauge by rpc.connection.healthy gives an approximation of average latency, but the top-level round-trip-latency histogram is more useful. Instead, users should consult the label families of this metric if they are available (which requires prometheus and the cluster setting ‘server.child_metrics.enabled’); these provide per-peer moving averages. This metric does not track failed connection. A failed connection’s contribution is reset to zero. | GAUGE | NANOSECONDS |
rpc.connection.failures | Counter of failed connections. This includes both the event in which a healthy connection terminates as well as unsuccessful reconnection attempts. Connections that are terminated as part of local node shutdown are excluded. Decommissioned peers are excluded. | COUNTER | COUNT |
rpc.connection.healthy | Gauge of current connections in a healthy state (i.e. bidirectionally connected and heartbeating) | GAUGE | COUNT |
rpc.connection.healthy_nanos | Gauge of nanoseconds of healthy connection time On the prometheus endpoint scraped with the cluster setting ‘server.child_metrics.enabled’ set, the constituent parts of this metric are available on a per-peer basis and one can read off for how long a given peer has been connected | GAUGE | NANOSECONDS |
rpc.connection.heartbeats | Counter of successful heartbeats. | COUNTER | COUNT |
rpc.connection.tcp_rtt | Kernel-level TCP round-trip time as measured by the Linux TCP stack. This metric reports the smoothed round-trip time (SRTT) as maintained by the kernel’s TCP implementation. Unlike application-level RPC latency measurements, this reflects pure network latency and is less affected by CPU overload effects. This metric is only available on Linux. | GAUGE | NANOSECONDS |
rpc.connection.tcp_rtt_var | Kernel-level TCP round-trip time variance as measured by the Linux TCP stack. This metric reports the smoothed round-trip time variance (RTTVAR) as maintained by the kernel’s TCP implementation. This measures the stability of the connection latency. This metric is only available on Linux. | GAUGE | NANOSECONDS |
rpc.connection.unhealthy | Gauge of current connections in an unhealthy state (not bidirectionally connected or heartbeating) | GAUGE | COUNT |
rpc.connection.unhealthy_nanos | Gauge of nanoseconds of unhealthy connection time. On the prometheus endpoint scraped with the cluster setting ‘server.child_metrics.enabled’ set, the constituent parts of this metric are available on a per-peer basis and one can read off for how long a given peer has been unreachable | GAUGE | NANOSECONDS |
schedules.BACKUP.failed | Number of BACKUP jobs failed | COUNTER | COUNT |
schedules.BACKUP.last-completed-time | The unix timestamp of the most recently completed backup by a schedule specified as maintaining this metric | GAUGE | TIMESTAMP_SEC |
schedules.scheduled-row-level-ttl-executor.failed | Number of scheduled-row-level-ttl-executor jobs failed | COUNTER | COUNT |
seconds.until.enterprise.license.expiry | Seconds until enterprise license expiry (0 if no license present or running without enterprise features) | GAUGE | TIMESTAMP_SEC |
security.certificate.expiration.ca | Expiration for the CA certificate. 0 means no certificate or error. | GAUGE | TIMESTAMP_SEC |
security.certificate.expiration.ca-client-tenant | Expiration for the Tenant Client CA certificate. 0 means no certificate or error. | GAUGE | TIMESTAMP_SEC |
security.certificate.expiration.client | Minimum expiration for client certificates, labeled by SQL user. 0 means no certificate or error. | GAUGE | TIMESTAMP_SEC |
security.certificate.expiration.client-ca | Expiration for the client CA certificate. 0 means no certificate or error. | GAUGE | TIMESTAMP_SEC |
security.certificate.expiration.client-tenant | Expiration for the Tenant Client certificate. 0 means no certificate or error. | GAUGE | TIMESTAMP_SEC |
security.certificate.expiration.node | Expiration for the node certificate. 0 means no certificate or error. | GAUGE | TIMESTAMP_SEC |
security.certificate.expiration.node-client | Expiration for the node’s client certificate. 0 means no certificate or error. | GAUGE | TIMESTAMP_SEC |
security.certificate.expiration.ui | Expiration for the UI certificate. 0 means no certificate or error. | GAUGE | TIMESTAMP_SEC |
security.certificate.expiration.ui-ca | Expiration for the UI CA certificate. 0 means no certificate or error. | GAUGE | TIMESTAMP_SEC |
security.certificate.ttl.ca | Seconds till expiration for the CA certificate. 0 means expired, no certificate or error. | GAUGE | TIMESTAMP_SEC |
security.certificate.ttl.ca-client-tenant | Seconds till expiration for the Tenant Client CA certificate. 0 means expired, no certificate or error. | GAUGE | TIMESTAMP_SEC |
security.certificate.ttl.client | Seconds till expiration for the client certificates, labeled by SQL user. 0 means expired, no certificate or error. | GAUGE | TIMESTAMP_SEC |
security.certificate.ttl.client-ca | Seconds till expiration for the client CA certificate. 0 means expired, no certificate or error. | GAUGE | TIMESTAMP_SEC |
security.certificate.ttl.client-tenant | Seconds till expiration for the Tenant Client certificate. 0 means expired, no certificate or error. | GAUGE | TIMESTAMP_SEC |
security.certificate.ttl.node | Seconds till expiration for the node certificate. 0 means expired, no certificate or error. | GAUGE | TIMESTAMP_SEC |
security.certificate.ttl.node-client | Seconds till expiration for the node’s client certificate. 0 means expired, no certificate or error. | GAUGE | TIMESTAMP_SEC |
security.certificate.ttl.ui | Seconds till expiration for the UI certificate. 0 means expired, no certificate or error. | GAUGE | TIMESTAMP_SEC |
security.certificate.ttl.ui-ca | Seconds till expiration for the UI CA certificate. 0 means expired, no certificate or error. | GAUGE | TIMESTAMP_SEC |
sql.conn.failures | Number of SQL connection failures | COUNTER | COUNT |
sql.conn.latency | Latency to establish and authenticate a SQL connection | HISTOGRAM | NANOSECONDS |
sql.conns | Number of open SQL connections | GAUGE | COUNT |
sql.ddl.count | Number of SQL DDL statements successfully executed | COUNTER | COUNT |
sql.delete.count | Number of SQL DELETE statements successfully executed | COUNTER | COUNT |
sql.distsql.contended_queries.count | Number of SQL queries that experienced contention | COUNTER | COUNT |
sql.exec.latency | Latency of SQL statement execution | HISTOGRAM | NANOSECONDS |
sql.failure.count | Number of statements resulting in a planning or runtime error | COUNTER | COUNT |
sql.full.scan.count | Number of full table or index scans | COUNTER | COUNT |
sql.insert.count | Number of SQL INSERT statements successfully executed | COUNTER | COUNT |
sql.mem.root.current | Current sql statement memory usage for root | GAUGE | BYTES |
sql.new_conns | Number of SQL connections created | COUNTER | COUNT |
sql.query.count | Number of SQL operations started including queries, and transaction control statements | COUNTER | COUNT |
sql.routine.delete.count | Number of SQL DELETE statements successfully executed within routine invocation | COUNTER | COUNT |
sql.routine.insert.count | Number of SQL INSERT statements successfully executed within routine invocation | COUNTER | COUNT |
sql.routine.select.count | Number of SQL SELECT statements successfully executed within routine invocation | COUNTER | COUNT |
sql.routine.update.count | Number of SQL UPDATE statements successfully executed within routine invocation | COUNTER | COUNT |
sql.select.count | Number of SQL SELECT statements successfully executed | COUNTER | COUNT |
sql.service.latency | Latency of SQL request execution | HISTOGRAM | NANOSECONDS |
sql.statements.active | Number of currently active user SQL statements | GAUGE | COUNT |
sql.txn.abort.count | Number of SQL transaction abort errors | COUNTER | COUNT |
sql.txn.begin.count | Number of SQL transaction BEGIN statements successfully executed | COUNTER | COUNT |
sql.txn.commit.count | Number of SQL transaction COMMIT statements successfully executed | COUNTER | COUNT |
sql.txn.latency | Latency of SQL transactions | HISTOGRAM | NANOSECONDS |
sql.txn.rollback.count | Number of SQL transaction ROLLBACK statements successfully executed | COUNTER | COUNT |
sql.txns.open | Number of currently open user SQL transactions | GAUGE | COUNT |
sql.update.count | Number of SQL UPDATE statements successfully executed | COUNTER | COUNT |
storage.disk-slow | Number of instances of disk operations taking longer than 10s | COUNTER | COUNT |
storage.disk-stalled | Number of instances of disk operations taking longer than 20s | COUNTER | COUNT |
storage.disk.iopsinprogress | IO operations currently in progress on the store’s disk (as reported by the OS) | GAUGE | COUNT |
storage.disk.read-max.bytespersecond | Maximum rate at which bytes were read from disk (as reported by the OS) | GAUGE | BYTES |
storage.disk.read.bytes | Bytes read from the store’s disk since this process started (as reported by the OS) | COUNTER | BYTES |
storage.disk.read.count | Disk read operations on the store’s disk since this process started (as reported by the OS) | COUNTER | COUNT |
storage.disk.write-max.bytespersecond | Maximum rate at which bytes were written to disk (as reported by the OS) | GAUGE | BYTES |
storage.disk.write.bytes | Bytes written to the store’s disk since this process started (as reported by the OS) | COUNTER | BYTES |
storage.disk.write.count | Disk write operations on the store’s disk since this process started (as reported by the OS) | COUNTER | COUNT |
storage.keys.tombstone.count | Approximate count of DEL, SINGLEDEL and RANGEDEL internal keys across the storage engine. | GAUGE | COUNT |
storage.l0-level-size | Size of the SSTables in level 0 | GAUGE | BYTES |
storage.wal.failover.switch.count | Count of the number of times WAL writing has switched from primary to secondary and vice versa. | COUNTER | COUNT |
storage.wal.failover.write_and_sync.latency | The observed latency for writing and syncing to the logical Write-Ahead Log. | HISTOGRAM | NANOSECONDS |
storage.wal.fsync.latency | The fsync latency to the Write-Ahead Log device. | HISTOGRAM | NANOSECONDS |
storage.write-stall-nanos | Total write stall duration in nanos | COUNTER | NANOSECONDS |
storage.write-stalls | Number of instances of intentional write stalls to backpressure incoming writes | COUNTER | COUNT |
storeliveness.heartbeat.failures | Number of Store Liveness heartbeats that failed to be sent out by the Store Liveness Support Manager | COUNTER | COUNT |
sys.cgo.allocbytes | Current bytes of memory allocated by cgo | GAUGE | BYTES |
sys.cgo.totalbytes | Total bytes of memory allocated by cgo, but not released | GAUGE | BYTES |
sys.cpu.combined.percent-normalized | Current user+system cpu percentage consumed by the CRDB process, normalized 0-1 by number of cores | GAUGE | PERCENT |
sys.cpu.host.combined.percent-normalized | Current user+system cpu percentage across the whole machine, normalized 0-1 by number of cores | GAUGE | PERCENT |
sys.cpu.sys.ns | Total system cpu time consumed by the CRDB process | COUNTER | NANOSECONDS |
sys.cpu.sys.percent | Current system cpu percentage consumed by the CRDB process | GAUGE | PERCENT |
sys.cpu.user.ns | Total user cpu time consumed by the CRDB process | COUNTER | NANOSECONDS |
sys.cpu.user.percent | Current user cpu percentage consumed by the CRDB process | GAUGE | PERCENT |
sys.gc.count | Total number of GC runs | COUNTER | COUNT |
sys.gc.pause.ns | Total GC pause | COUNTER | NANOSECONDS |
sys.gc.pause.percent | Current GC pause percentage | GAUGE | PERCENT |
sys.go.allocbytes | Current bytes of memory allocated by go | GAUGE | BYTES |
sys.go.heap.allocbytes | Cumulative bytes allocated for heap objects. | COUNTER | BYTES |
sys.go.heap.heapfragmentbytes | Total heap fragmentation bytes, derived from bytes in in-use spans minus bytes allocated | GAUGE | BYTES |
sys.go.totalbytes | Total bytes of memory allocated by go, but not released | GAUGE | BYTES |
sys.goroutines | Current number of goroutines | GAUGE | COUNT |
sys.host.disk.iopsinprogress | IO operations currently in progress on this host (as reported by the OS) | GAUGE | COUNT |
sys.host.disk.read.bytes | Bytes read from all disks since this process started (as reported by the OS) | COUNTER | BYTES |
sys.host.disk.read.count | Disk read operations across all disks since this process started (as reported by the OS) | COUNTER | COUNT |
sys.host.disk.write.bytes | Bytes written to all disks since this process started (as reported by the OS) | COUNTER | BYTES |
sys.host.disk.write.count | Disk write operations across all disks since this process started (as reported by the OS) | COUNTER | COUNT |
sys.host.net.recv.bytes | Bytes received on all network interfaces since this process started (as reported by the OS) | COUNTER | BYTES |
sys.host.net.send.bytes | Bytes sent on all network interfaces since this process started (as reported by the OS) | COUNTER | BYTES |
sys.host.net.send.tcp.retrans_segs | The number of TCP segments retransmitted across all network interfaces. This can indicate packet loss occurring in the network. However, it can also be caused by recipient nodes not consuming packets in a timely manner, or the local node overflowing its outgoing buffers, for example due to overload. Retransmissions also occur in the absence of problems, as modern TCP stacks err on the side of aggressively retransmitting segments. The linux tool ‘ss -i’ can show the Linux kernel’s smoothed view of round-trip latency and variance on a per-connection basis. Additionally, ‘netstat -s’ shows all TCP counters maintained by the kernel. | COUNTER | COUNT |
sys.rss | Current process RSS | GAUGE | BYTES |
sys.runnable.goroutines.per.cpu | Average number of goroutines that are waiting to run, normalized by number of cores | GAUGE | COUNT |
sys.totalmem | Total memory (both free and used) | GAUGE | BYTES |
sys.uptime | Process uptime | COUNTER | SECONDS |
txn.restarts | Number of restarted KV transactions | HISTOGRAM | COUNT |
txn.restarts.serializable | Number of restarts due to a forwarded commit timestamp and isolation=SERIALIZABLE | COUNTER | COUNT |
txn.restarts.txnaborted | Number of restarts due to an abort by a concurrent transaction (usually due to deadlock) | COUNTER | COUNT |
txn.restarts.txnpush | Number of restarts due to a transaction push failure | COUNTER | COUNT |
txn.restarts.unknown | Number of restarts due to a unknown reasons | COUNTER | COUNT |
txn.restarts.writetooold | Number of restarts due to a concurrent writer committing first | COUNTER | COUNT |
txnwaitqueue.deadlocks_total | Number of deadlocks detected by the txn wait queue | COUNTER | COUNT |