

- Analyze using
crdb_internaltables: A process to determine which workload and queries are involved in the contention. - Analysis of support scenario: An application of the previously described analysis process to a hypothetical support incident.
- Analyze using Insights page: Basic examples of lock contention are addressed.
Monitor using Console
The and provide monitoring of contention using the following features:Contention metrics are typically presented with count and duration information. Both lock contention and serializable conflicts will be recorded in count-related metrics, but only lock contention will be included in duration-related metrics.
SQL Statement Contention graph
On the SQL dashboard within the Metrics page, the SQL Statement Contention graph ( or ) shows the rate of contention events per second across the cluster. This graph is based on the metric, which measures the rate of contention events per second across the cluster. In the DB Console, in the cluster view, this rate is averaged across all nodes, which sometimes makes it difficult to interpret. When viewing an individual node, it shows the rate for that single node. The following image from the DB Console was taken from a cluster running more than 50,000 queries per second with around 2 contention events per second. This contention is unlikely to have an impact on the workload.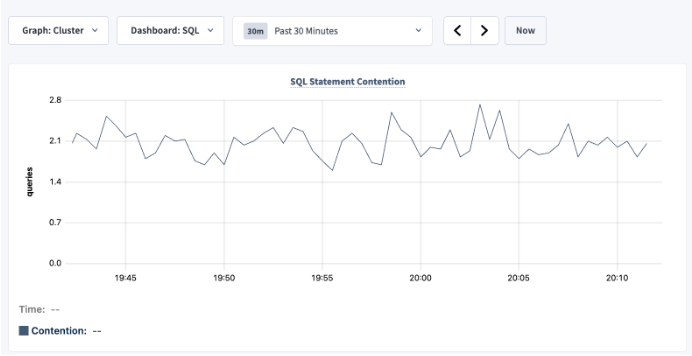
SQL Activity pages
SQL Activity has per statement and per transaction contention information.Statements page
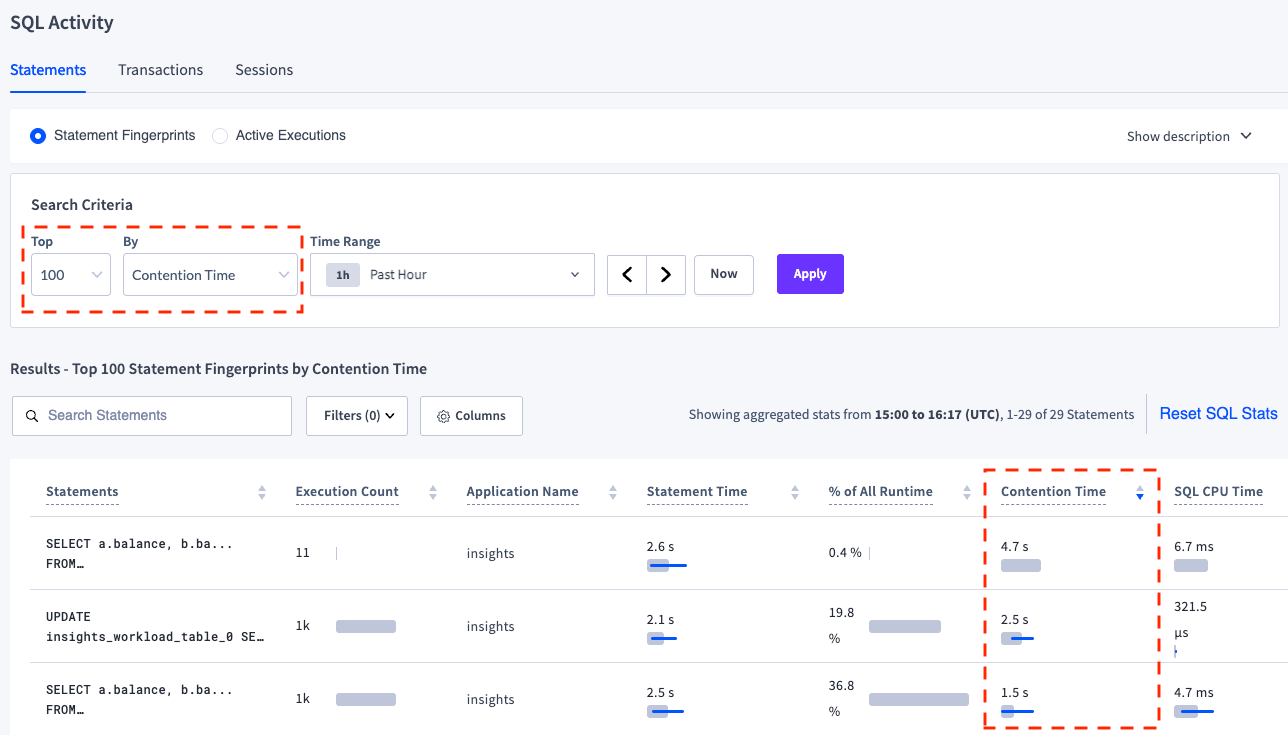
The Statements page ( or ) shows statements that were involved in contention events. To view these statements, change the search criteria to view the top 100 by Contention Time, then sort descending by Contention Time column. The column displays the average time and standard deviation of contention events. Note that only lock contention events are included in the contention time. The following image shows the Statements page with the top 3 statement fingerprints by Contention Time in a cluster containing the test data from the Analyze usingcrdb_internal tables section.
Transactions page
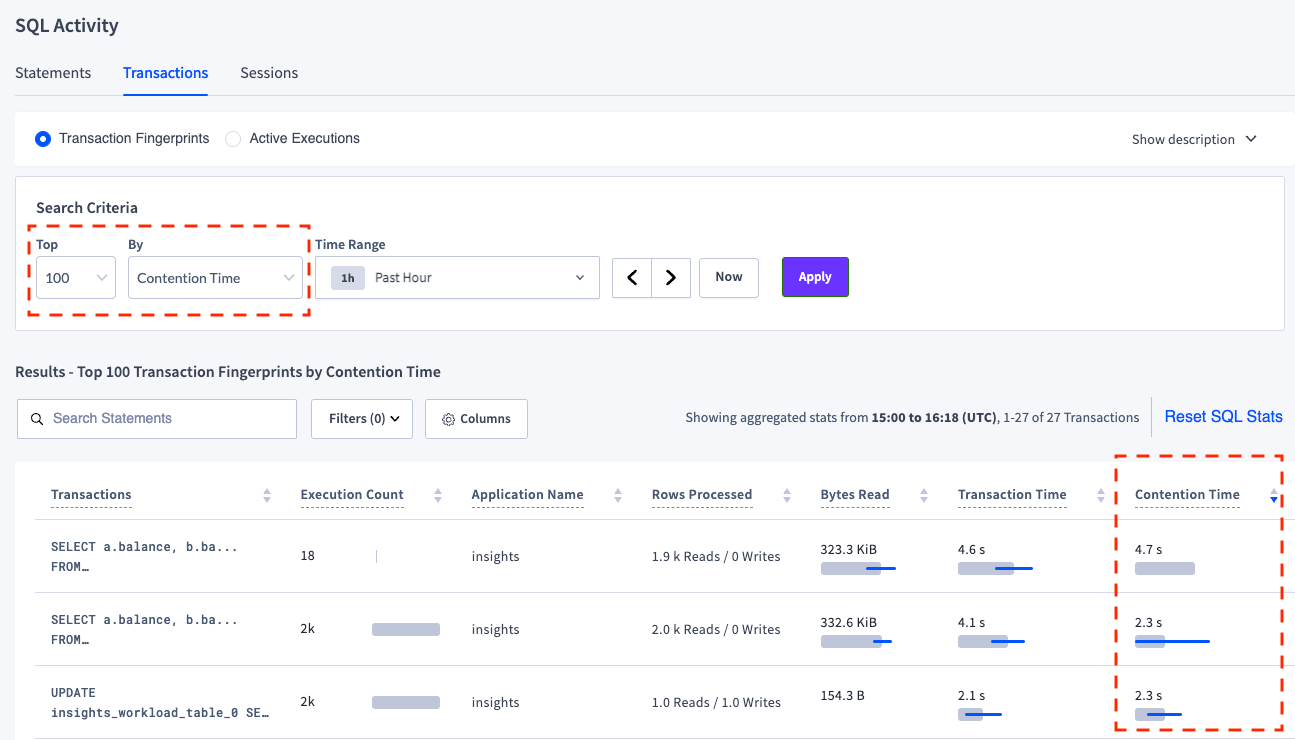
The Transactions page ( or ) shows transactions that were involved in contention events. To view these transactions, change the search criteria to view the top 100 transaction fingerprints by Contention Time, then sort descending by Contention Time column. The displays the average and standard deviation of the time spent in contention. Note that only lock contention events are included in the contention time. The following image shows the Transactions page with the top 3 transactions fingerprints by Contention Time in a cluster containing the test data in the Analyze usingcrdb_internal tables section.
Insights page
The Insights page ( or ) displays a variety of on statement and transaction executions related to transaction contention:-
A statement or transaction is classified as Slow Execution if it meets either of the following criteria:
- The execution took longer than the configured .
- Anomaly detection is enabled () and the execution was greater than twice the median execution latency and higher than .
- After meeting the Slow Execution criteria, an execution is classified as High Contention if a significant portion of its duration was due to contention.
- A failed statement or transaction is identified as a Failed Execution. If the transaction fails due to a serialization error caused by contention, a conflicting or blocking transaction is recorded. The execution details display the conflicting transaction.
Monitor using metrics
As part of normal operation, CockroachDB continuously records that are often useful in troubleshooting performance. The way metrics are exposed depends on the deployment type. Refer to:
Correlate these metrics with information from the and pages to identify the affected database.
Monitor using logs
CockroachDB periodically summarizes resolved contention activity as structured log events on the . Eachaggregated_contention_info reports:
- the waiting statement and transaction fingerprints
- the blocking transaction fingerprint
- the contended key (if not redacted)
- the total wait time for that combination since the previous event
SQL_EXEC channel to a destination, such as a log file or external collector, for long-term analysis.
These periodic reports complement the in-memory crdb_internal.transaction_contention_events table by providing a durable view of contention history that persists across or after contention data expires from the event store. Reports are generated at an interval defined by the cluster setting sql.contention.event_store.resolution_interval.
The structured payload makes it easy to ingest the events into log analytics tools and correlate them with statement fingerprints or . A typical structured log entry looks like the following:
Monitor using crdb_internal tables
The system catalog is a schema that contains information about internal objects, processes, and metrics related to a specific database. crdb_internal tables are read-only.
Not all
crdb_internal tables are production-ready. Consult the page for their current status.transaction_contention_events table
The virtual table contains information about historical transaction contention events. By default, lock contention events and serializable conflicts with a blocking transaction are stored in memory on each node and exposed via SQL in this virtual table.
Querying the
crdb_internal.transaction_contention_events table triggers an expensive RPC fan-out to all nodes, making it a resource-intensive operation. Avoid frequent polling and do not use this table for continuous monitoring.crdb_internal.transaction_contention_events displays in-memory data, not on-disk data. The data changes over time as new events arrive and old ones are evicted from the cache.LOCK_WAIT: Indicates that the transaction waited on a specific key. The record includes the key and the wait duration.SERIALIZATION_CONFLICT: Represents a serialization conflict specific to a transaction execution. This is recorded only when a containing the conflicting transaction details is emitted.
contention_type is not modified. A transaction may have multiple LOCK_WAIT events, as they correspond to specific keys, but only one SERIALIZATION_CONFLICT event.
The transaction and statement fingerprint IDs (*_txn_fingerprint_id and *_stmt_fingerprint_id) columns are hexadecimal values that can be used to look up the SQL and other information from the and tables. These should not be confused with the transaction and statement IDs (*_txn_id and *_stmt_id), which are unique for each transaction and statement execution.
Use the crdb_internal.transaction_contention_events table to summarize the frequency and duration of contention events by database, schema, table, and index. This helps identify workloads with the highest frequency and duration of contention events and the indexes where they occur. The table includes details about specific transactions and statements involved in contention, enabling deeper analysis.
Other tables
There are several other tables that can give insights into contention.-
These are views based on
crdb_internal.transaction_contention_eventsthat group all events by index, table, and key, respectively. A start and end time cannot be provided, so they count every event that is currently stored. As a result, these act more like counter metrics, which can be misleading since high values do not always indicate a high contention rate. - This is a virtual table that contains information about locks held by transactions on specific keys. It only shows this information for locks held at the time the table is queried.
Querying the
crdb_internal.cluster_locks table triggers an RPC fan-out to all nodes in the cluster, which can make it a relatively expensive operation.Continuous monitoring
CockroachDB offers tools to monitor contention, but it is important to turn this data into actionable insights. The main question is: “Does contention significantly affect this workload?” Ideally, continuous monitoring should answer this without manual effort. At the cluster level, track how often contention happens compared to overall throughput. For example, divide the rate of contention events ( metric) by the total number of queries ( metric) to get the percentage of queries affected by contention. This provides a high-level indicator of how frequently contention occurs but does not identify specific workloads. If contention affects more than 1% of queries, use thecrdb_internal table analysis to identify the impacted workloads and queries.
Querying the crdb_internal.transaction_contention_events table triggers an expensive RPC fan-out to all nodes, making it a resource-intensive operation. Avoid frequent polling and do not use this table for continuous monitoring.
Analyze using crdb_internal tables
Not all crdb_internal tables are production-ready. Consult the page for their current status.
To analyze contention causes, use , and tables.
Retrieve the frequency and duration of contention events for a specific time period. Summarize the data at the database, schema, table, and index levels to identify workloads with significant lock contention. Because some contention is expected, compare the frequency and duration of contention events with the overall workload volume to assess their impact.
Analyze individual transactions and statements to understand the specific causes and impacts of contention. Use transaction and statement fingerprints to look up detailed information from the crdb_internal.transaction_statistics and crdb_internal.statement_statistics tables, such as the specific SQL statements.
Run insights workload
Use two terminals to analyze contention in the sample insights workload.
-
In Terminal 1, use the command to start a temporary, in-memory CockroachDB cluster of one node. Once the cluster is started, an interactive SQL shell will connect to that cluster. This shell will be used in the analysis process.
-
In Terminal 2, use to load the initial schema on the demo cluster:
Then, run the workload for 10 minutes:You’ll see per-operation statistics print to standard output every second:After the specified duration (10 minutes in this case), the workload will stop and you’ll see totals printed to standard output:
- In the interactive SQL shell in Terminal 1, run the SQL queries in this test scenario.
transaction_contention_events
Query 1 time period
When analyzing contention in a workload, you need the time period when it occurred. For this test scenario, get the time period of contention events by finding themin and max of the collection_ts column. Adjust Query 2 and Query 3 with this time period clause.
Query 2 frequency and duration
Find the frequency, total duration, and average duration of contention events per database, schema, table, and index for the test time period. Internal contention events (e.g., tosystem tables) are excluded by omitting the fingerprints with the pattern '0000000000000000'.
insights_workload_table_0_pkey had 1281 contention events in the time period with a total duration of 11m37.3s and an average duration of 544ms.
Query 3 blocking and waiting transaction fingerprint IDs
To find the top 2 combinations of blocking transaction and waiting transactions and statements, modify the previous query by:- Grouping by
blocking_txn_fingerprint_id, waiting_txn_fingerprint_id,waiting_stmt_fingerprint_id. - Filtering by
database_name,table_name, andindex_name. - Then, placing the resulting query in a .
transaction_statistics
Query 4 blocking statement fingerprint IDs
To get the statements associated with the blocking transaction (\xebdfe9282ddfd5bd) from row_number 1, query the crdb_internal.transaction_statistics table:
statement_statistics
Query 5 blocking statement SQL
To get the SQL associated with the blocking statements, query thecrdb_internal.statement_statistics table using the blocking fingerprint IDs found in Query 4.
Query 6 waiting statement SQL
To get the SQL associated with the waiting statement, again query thecrdb_internal.statement_statistics table. Filter by the waiting fingerprint IDs found in Query 3 (for transaction, use \x275ef4f9eea20099 and for statement, use \x883d49b568a3b746).
row_number 2 in Query 3) of blocking and waiting transactions and statements.
This process provides a view of the actual statements that are involved in the highest frequency of contention events.
Analysis of support scenario
This section applies a variation of the previously described analysis process to a hypothetical support scenario where high contention occurred during a period of increased errors. Review the graphs to get a high-level understanding of the contention events. The graph shows an increase of errors during the time period of 9:16 to 9:23 UTC: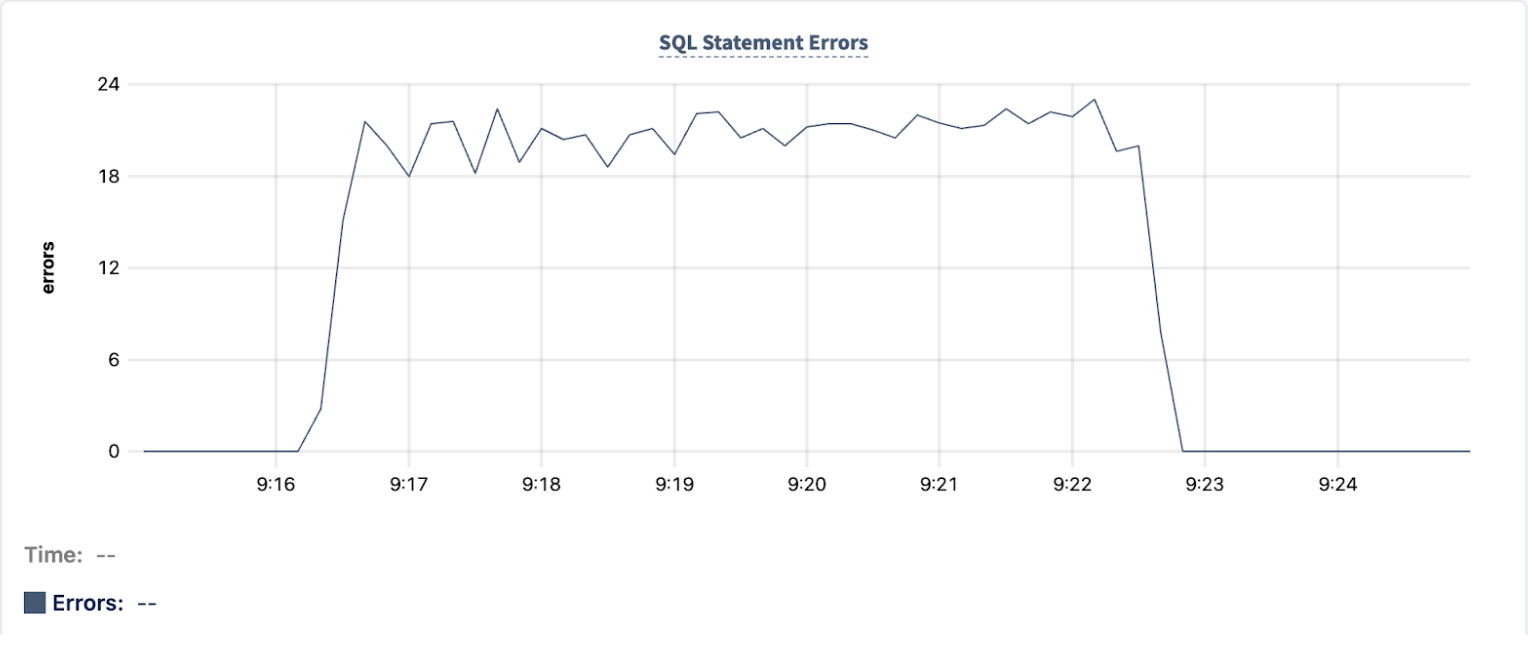
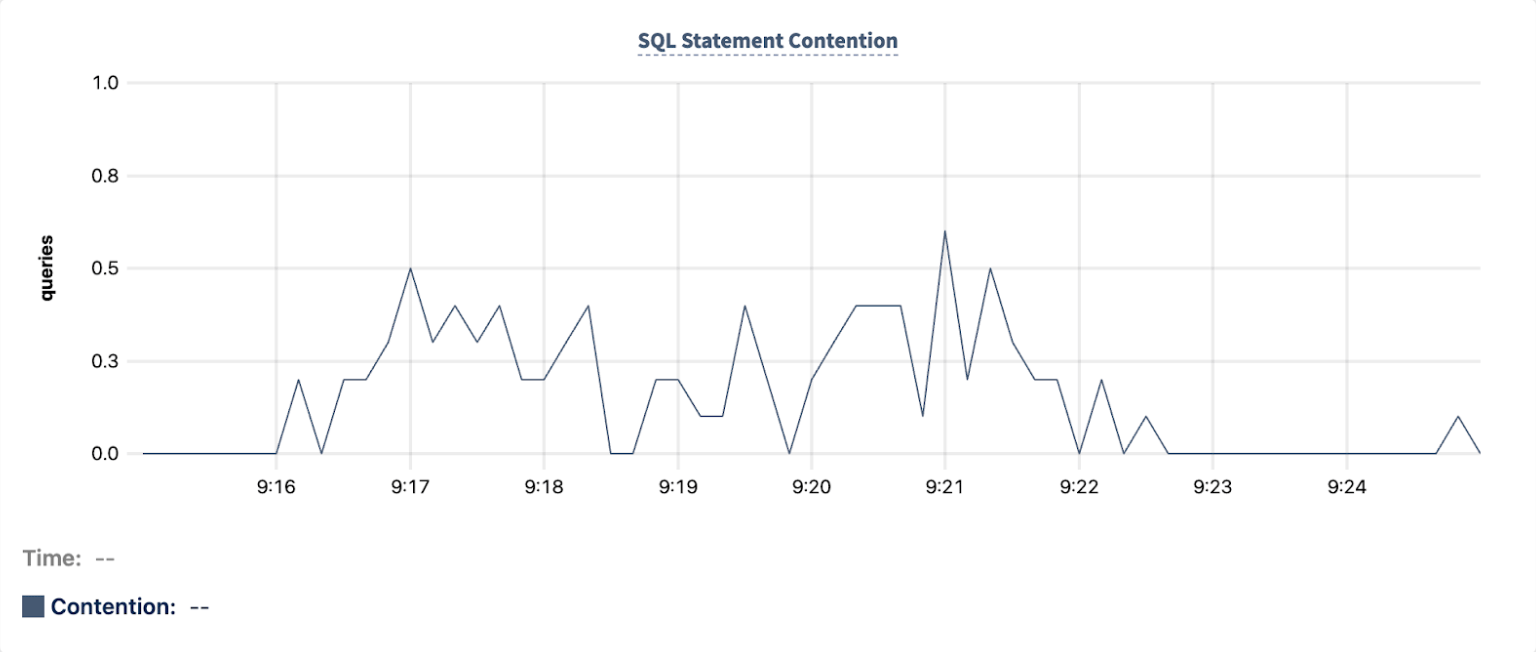
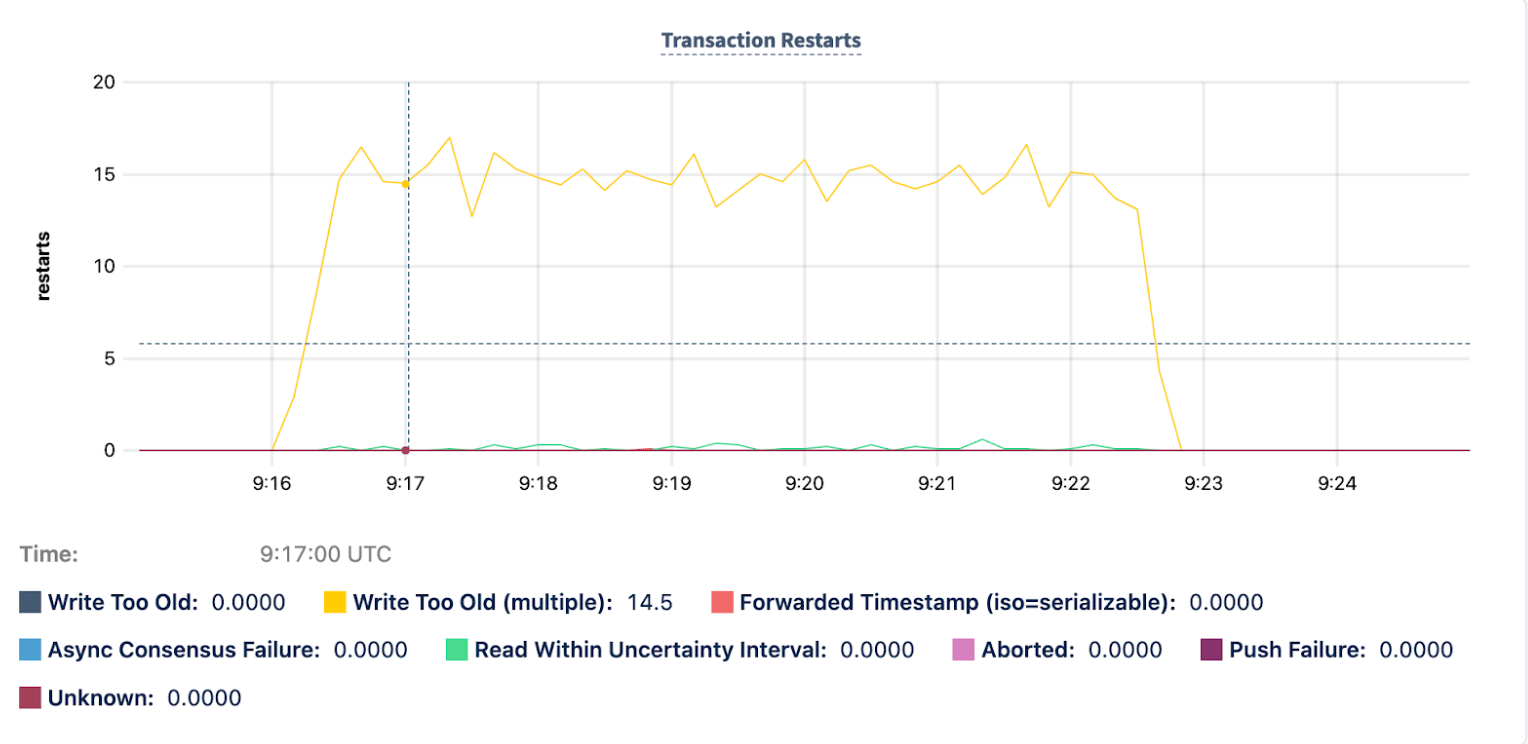
crdb_internal.transaction_contention_events table.
transaction_contention_events for support scenario
Query 1 frequency and duration
Find the frequency, total duration, and average duration of contention events per database, schema, table, and index for the time period. Internal contention events (e.g., tosystem tables) are excluded by omitting the fingerprints with the pattern '0000000000000000'.
UserOptions+userKey index on the UserOptions table.
Examine the table schema for UserOptions. Notice that the UserOptions+userKey index is a secondary unique index on the userKey column.
Query 2 specific contending_key
Determine which specific keys were involved in the contention events on that index:
"abcdefghijklmn") accounts for all of the contention events during the incident time period.
Query 3 blocking and waiting transaction fingerprint IDs
Determine which specific transactions and statements were involved in the contention events. Modify the query by updating thedatabase_name, table_name, and index_name. Increase the limit to 5.
\x9b06dfa27c208be3 and \x9b06f0a27c20af50. There is a single statement fingerprint that does all of the waiting: \x346562eefa213c3c.
transaction_statistics and statement_statistics
To examine the statements associated with the two transaction fingerprints, query the crdb_internal.transaction_statistics and crdb_internal.statement_statistics tables.
Query 4 row 1 blocking statement fingerprint IDs
To get the statement associated with the blocking transaction (\x9b06dfa27c208be3) from row_number 1, query the crdb_internal.transaction_statistics table.
Query 5 row 1 blocking statement metadata
Instead of only selecting themetadata->>'query' key as in Query 5 blocking statement SQL, select the whole JSONB metadata object to get more information about the statement (\x346562eefa213c3c).
metadata, the key "failed" has the value of true indicating failed statement executions.
Query 6 row 2 blocking statement fingerprint IDs
To get the statement associated with the blocking transaction (\x9b06f0a27c20af50) from row_number 2, query the crdb_internal.transaction_statistics table.
Query 7 row 2 blocking statement metadata
Instead of only selecting themetadata->>'query' key as in Query 5 blocking statement SQL, select the whole JSONB metadata object to get more information about the statement (\x34654deefa21188f).
metadata, the key "failed" has the value of false indicating successful statement executions.
Conclusion
Transactions from row 1 and row 2 executed the same SQL query. Both transactions involved and operations. Row 1 includes failed executions, while row 2 includes successful executions. This analysis indicates that a large number ofINSERT or UPDATE operations targeted the same userKey ("abcdefghijklmn") in the UserOptions@UserOptions+userKey index during the incident.
Next, investigate what in the application (app_name=permissions-api) may have caused this large number of updates on a single key.
Analyze using Insights page
While the previous analysis process uses thecrdb_internal tables, the performance tuning tutorial gives basic examples to understand lock contention and how to analyze it using the Insights page.
See also
- (DB Console) or (Cloud Console)
- Statements page ( or )
- Transactions page ( or )
- Insights page ( or )