

Dashboard navigation
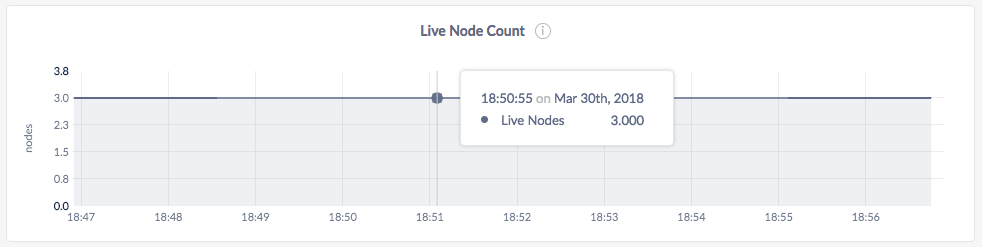
Use the Graph menu to display metrics for your entire cluster or for a specific node. To the right of the Graph and Dashboard menus, a time interval selector allows you to filter the view for a predefined or custom time interval. Use the navigation buttons to move to the previous, next, or current time interval. When you select a time interval, the same interval is selected in the pages. However, if you select 10 or 30 minutes, the interval defaults to 1 hour in SQL Activity pages. When viewing graphs, a tooltip will appear at your mouse cursor providing further insight into the data under the mouse cursor. Click anywhere within the graph to pin the tooltip in place, decoupling the tooltip from your mouse movements. Click anywhere within the graph to cause the tooltip to follow your mouse once more. The Runtime dashboard displays the following time series graphs:Live Node Count
Memory Usage
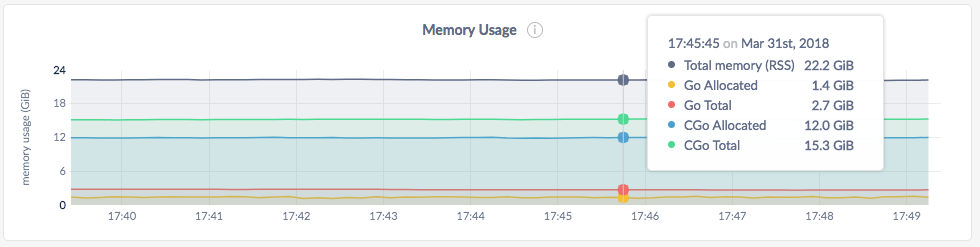
- In the node view, the graph shows the memory in use for the selected node.
- In the cluster view, the graph shows the memory in use across all nodes in the cluster.
| Metric | Description |
|---|---|
| RSS | Total memory in use by CockroachDB. |
| Go Allocated | Memory allocated by the Go layer. |
| Go Total | Total memory managed by the Go layer. |
| CGo Allocated | Memory allocated by the C layer. |
| CGo Total | Total memory managed by the C layer. |
Runnable Goroutines per CPU
This graph shows the number of Goroutines waiting to run per CPU. This graph should rise and fall based on CPU load. Values greater than 50 are considered high.- In the node view, the graph shows the number of Goroutines waiting per CPU on the selected node.
- In the cluster view, the graph shows the number of Goroutines waiting per CPU across all nodes in the cluster.
CPU Time
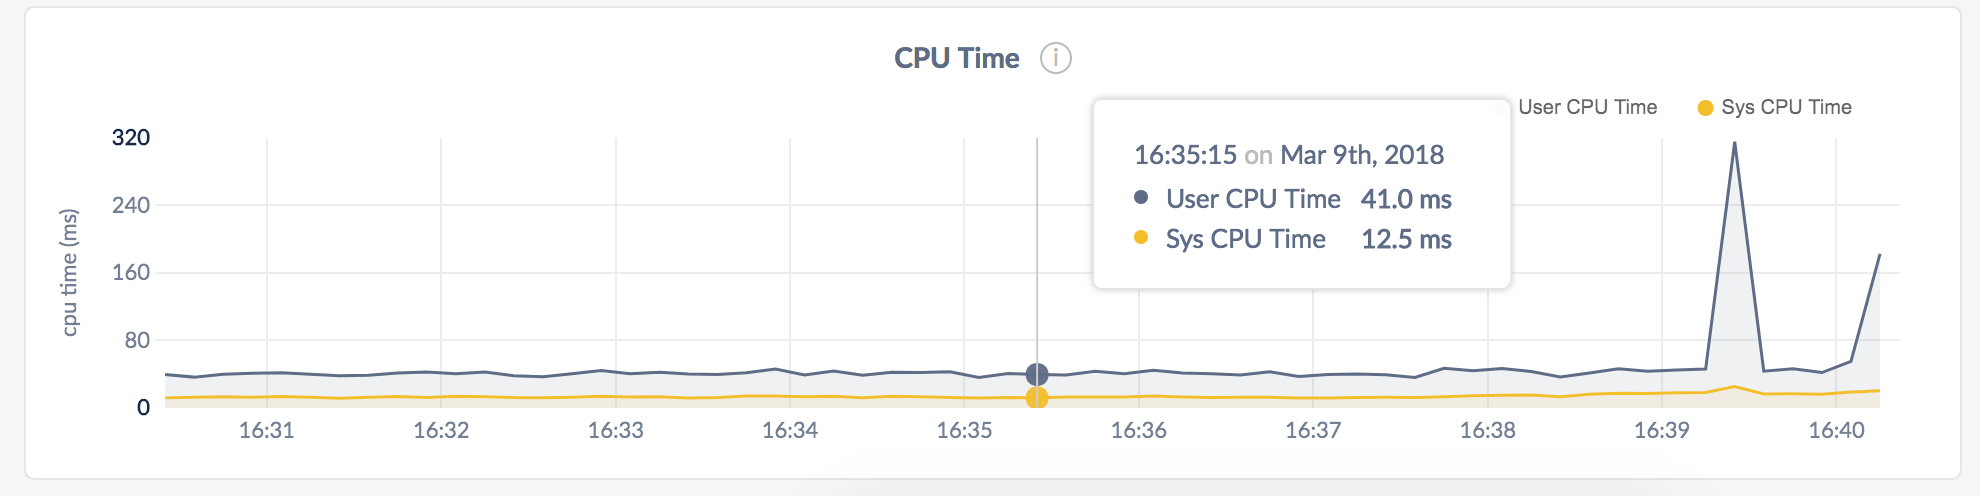
- In the node view, the graph shows the CPU time used by CockroachDB user and system-level operations for the selected node.
- In the cluster view, the graph shows the CPU time used by CockroachDB user and system-level operations across all nodes in the cluster.
| Metric | Description |
|---|---|
| User CPU Time | Total CPU seconds per second used by the CockroachDB process across all nodes. |
| Sys CPU Time | Total CPU seconds per second used for CockroachDB system-level operations across all nodes. |
Clock Offset
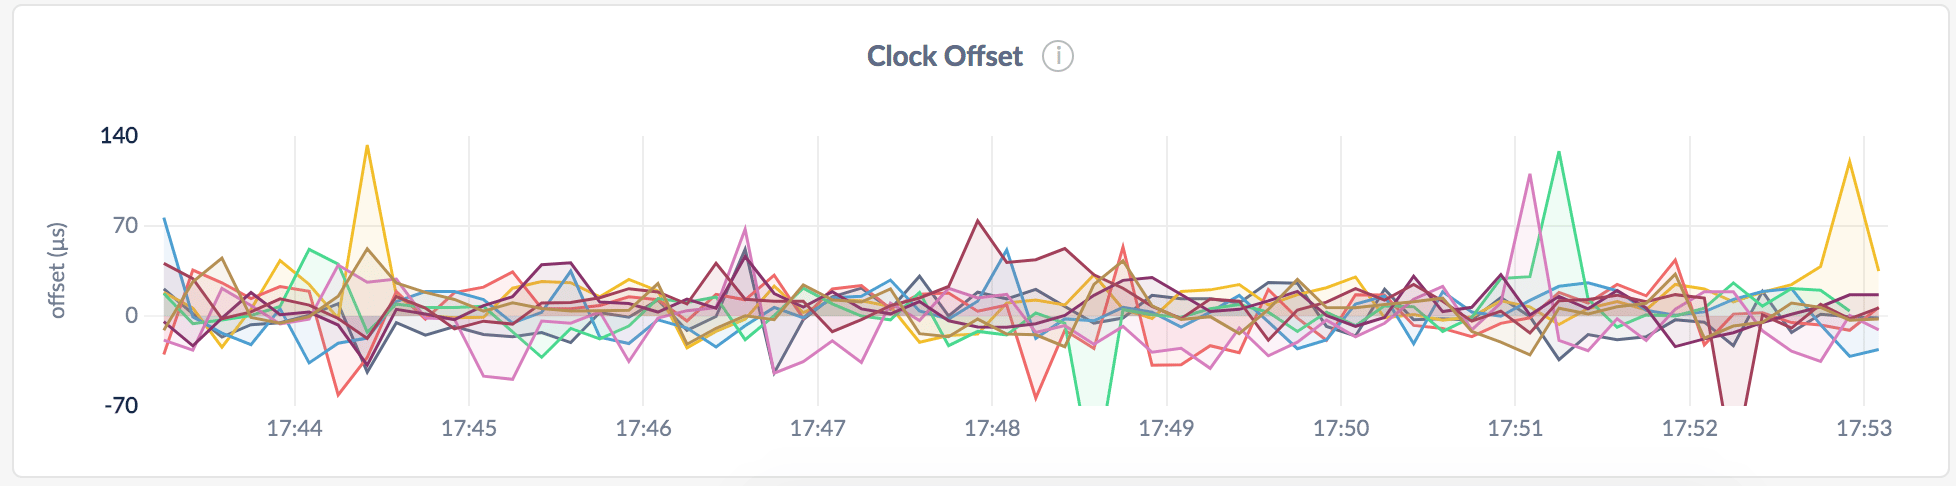
- In the node view, the graph shows the mean clock offset of the node against the rest of the cluster.
- In the cluster view, the graph shows the mean clock offset of each node against the rest of the cluster.
Other graphs
The Runtime dashboard shows other time series graphs that are important for CockroachDB developers:- Goroutine Count
- GC Runs
- GC Pause Time
Summary and events
Summary panel
A Summary panel of key metrics is displayed to the right of the timeseries graphs.| Metric | Description |
|---|---|
| Total Nodes | The total number of nodes in the cluster. Decommissioned nodes are not included in this count. |
| Capacity Used | The storage capacity used as a percentage of allocated across all nodes. |
| Unavailable Ranges | The number of unavailable ranges in the cluster. A non-zero number indicates an unstable cluster. |
| Queries per second | The total number of SELECT, UPDATE, INSERT, and DELETE queries executed per second across the cluster. |
| P99 Latency | The 99th percentile of service latency. |
Events panel
Underneath the Summary panel, the Events panel lists the 5 most recent events logged for all nodes across the cluster. To list all events, click View all events.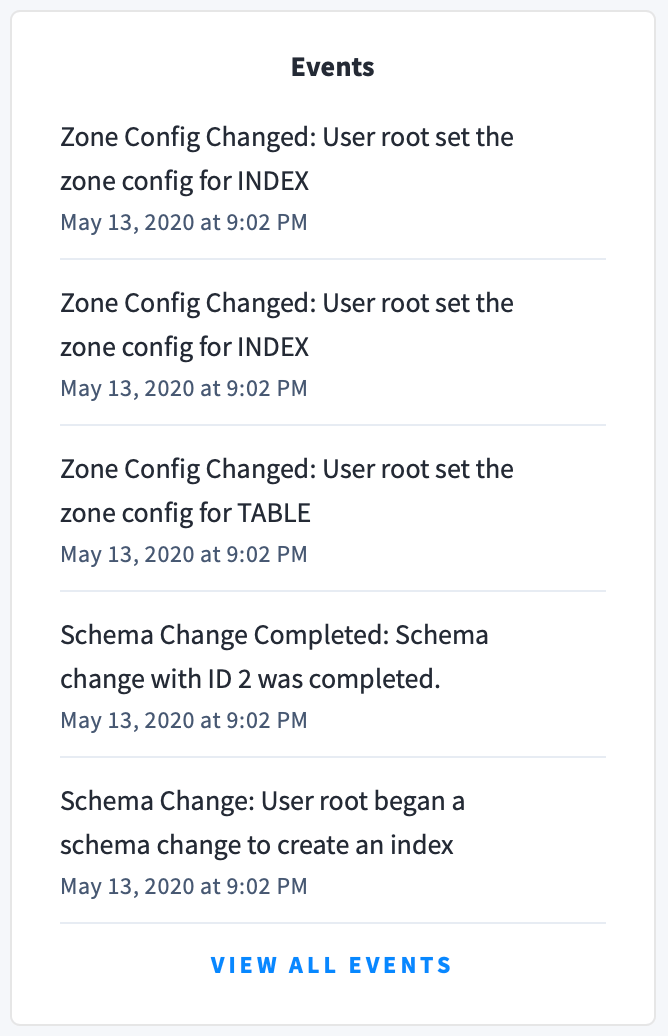
- Database created
- Database dropped
- Table created
- Table dropped
- Table altered
- Index created
- Index dropped
- View created
- View dropped
- Schema change reversed
- Schema change finished
- Node joined
- Node decommissioned
- Node restarted
- Cluster setting changed