> ## Documentation Index
> Fetch the complete documentation index at: https://cockroachlabs.mintlify.site/llms.txt
> Use this file to discover all available pages before exploring further.
# CockroachDB Resilience Demo
export const InternalLink = ({version, path = "", children, ...props}) => {
let detectedVersion = version || "stable";
if (typeof window !== 'undefined' && !version) {
const match = window.location.pathname.match(/\/docs\/([^/]+)/);
if (match) {
detectedVersion = match[1];
}
}
const normalizedPath = path.startsWith("/") ? path.slice(1) : path;
return
{children}
;
};
This page describes how to perform a hands-on demonstration of CockroachDB's fault-tolerant design allowing services to remain available during a failure and recovery.
## Run a guided demo in CockroachDB Cloud
CockroachDB Cloud Advanced includes a built-in fault tolerance demo in the Cloud Console that automatically runs a sample workload and executes a controlled availability zone failure on your cluster, showing real-time metrics of query latency and failure rate during the outage and recovery.
The CockroachDB Cloud fault tolerance demo is in Preview.
The following prerequisites are needed to run the fault tolerance demo:
* You must have CockroachDB Advanced cluster with at least three nodes.
* All nodes must be healthy.
* The cluster's CPU utilization must be below 30%.
* The cluster must not currently be in a locked state as a result of maintenance such as scaling. Clusters that were recently created may be locked intermittently while post-provisioning setup completes. Monitor your cluster's status in the Cloud Console to make sure it is not in a maintenance state.
* You must have the Cluster Operator and/or Cluster Admin role assigned to start the demo.
* Another fault tolerance demo must not currently be running.
In total, the fault tolerance demo takes approximately 10 to 15 minutes to complete. The demo creates a temporary database and demo workload on your cluster, then cleans up after the demo is complete. If the demo becomes stuck, the system will automatically force a full cleanup after 30 minutes. You do not need to contact support before this window has elapsed.
The fault tolerance demo is not recommended to be run on a production cluster. The demo temporarily blocks network communication to all nodes in one availability zone. This disruption is real, and may affect cluster performance during the outage window. Instead, use a dedicated test or staging cluster for the fault tolerance demo.
To run the fault tolerance demo, open the Cloud Console and navigate to the **Overview** page, then select **Actions > Fault tolerance demo**.
### Known limitations
The following known limitations apply to the fault tolerance demo in CockroachDB Cloud:
* QPS may briefly appear to drop to zero on the chart during or after the disruption phase. This occurs because metrics from the nodes in the disrupted availability zone are temporarily unavailable during the network block, it does not reflect actual cluster behavior. The unaffected nodes continue serving traffic normally.
* If you cancel the fault tolerance demo and immediately try to start a new one, you may encounter an error. Wait a few minutes before starting again.
* Clean-up of the temporary workload and database may continue for a few minutes after the demo ends. Refresh the Console page if the message does not clear after a few minutes.
## Run a manual demo on a local machine
This guide walks you through a simple demonstration of CockroachDB's resilience on a local cluster deployment.
Starting with a 6-node local cluster with the default 3-way replication, you will perform the following steps:
1. Run a sample workload.
2. Terminate a node to simulate failure.
3. Observe the cluster continuing to serve query traffic uninterrupted during the failure state.
4. Observe the cluster repair itself by re-replicating missing data to other nodes.
5. Prepare the cluster for 2 simultaneous node failures by increasing to 5-way replication. ^.6. Take two nodes offline at the same time, and again observe how the cluster continues uninterrupted.
### Before you begin
Make sure you have already installed CockroachDB.
### Step 1. Start a 6-node cluster
1. In separate terminal windows, use the `cockroach start` command to start six nodes:
```shell theme={"theme":{"light":"catppuccin-mocha","dark":"catppuccin-mocha"}}
$ cockroach start \
--insecure \
--store=fault-node1 \
--listen-addr=localhost:26257 \
--http-addr=localhost:8080 \
--join=localhost:26257,localhost:26258,localhost:26259
```
```shell theme={"theme":{"light":"catppuccin-mocha","dark":"catppuccin-mocha"}}
$ cockroach start \
--insecure \
--store=fault-node2 \
--listen-addr=localhost:26258 \
--http-addr=localhost:8081 \
--join=localhost:26257,localhost:26258,localhost:26259
```
```shell theme={"theme":{"light":"catppuccin-mocha","dark":"catppuccin-mocha"}}
$ cockroach start \
--insecure \
--store=fault-node3 \
--listen-addr=localhost:26259 \
--http-addr=localhost:8082 \
--join=localhost:26257,localhost:26258,localhost:26259
```
```shell theme={"theme":{"light":"catppuccin-mocha","dark":"catppuccin-mocha"}}
$ cockroach start \
--insecure \
--store=fault-node4 \
--listen-addr=localhost:26260 \
--http-addr=localhost:8083 \
--join=localhost:26257,localhost:26258,localhost:26259
```
```shell theme={"theme":{"light":"catppuccin-mocha","dark":"catppuccin-mocha"}}
$ cockroach start \
--insecure \
--store=fault-node5 \
--listen-addr=localhost:26261 \
--http-addr=localhost:8084 \
--join=localhost:26257,localhost:26258,localhost:26259
```
```shell theme={"theme":{"light":"catppuccin-mocha","dark":"catppuccin-mocha"}}
$ cockroach start \
--insecure \
--store=fault-node6 \
--listen-addr=localhost:26262 \
--http-addr=localhost:8085 \
--join=localhost:26257,localhost:26258,localhost:26259
```
2. Use the `cockroach init` command to perform a one-time initialization of the cluster:
```shell theme={"theme":{"light":"catppuccin-mocha","dark":"catppuccin-mocha"}}
$ cockroach init --insecure --host=localhost:26257
```
### Step 2. Set up load balancing
In this tutorial, you run a sample workload to simulate multiple client connections. Each node is an equally suitable SQL gateway for the load, but it's always recommended to spread requests evenly across nodes. This section shows how to set up the open-source [HAProxy](http://www.haproxy.org/) load balancer.
1. Install HAProxy.
If you're on a Mac and use Homebrew, run:
```shell theme={"theme":{"light":"catppuccin-mocha","dark":"catppuccin-mocha"}}
$ brew install haproxy
```
If you're using Linux and use apt-get, run:
```shell theme={"theme":{"light":"catppuccin-mocha","dark":"catppuccin-mocha"}}
$ sudo apt-get install haproxy
```
2. Run the `cockroach gen haproxy` command, specifying the port of any node:
```shell theme={"theme":{"light":"catppuccin-mocha","dark":"catppuccin-mocha"}}
$ cockroach gen haproxy --insecure --host=localhost --port=26257
```
This command generates an `haproxy.cfg` file automatically configured to work with the nodes of your running cluster.
3. In `haproxy.cfg`, change `bind :26257` to `bind :26000`. This changes the port on which HAProxy accepts requests to a port that is not already in use by a node.
```shell theme={"theme":{"light":"catppuccin-mocha","dark":"catppuccin-mocha"}}
sed -i.saved 's/^ bind :26257/ bind :26000/' haproxy.cfg
```
4. Start HAProxy, with the `-f` flag pointing to the `haproxy.cfg` file:
```shell theme={"theme":{"light":"catppuccin-mocha","dark":"catppuccin-mocha"}}
$ haproxy -f haproxy.cfg &
```
### Step 3. Run a sample workload
Use the `cockroach workload` command to run CockroachDB's built-in version of the YCSB benchmark, simulating multiple client connections, each performing mixed read/write operations.
1. Load the initial `ycsb` schema and data, pointing it at HAProxy's port:
```shell theme={"theme":{"light":"catppuccin-mocha","dark":"catppuccin-mocha"}}
$ cockroach workload init ycsb --splits=50 'postgresql://root@localhost:26000?sslmode=disable'
```
The `--splits` flag tells the workload to manually split ranges a number of times. This is not something you'd normally do, but for the purpose of this tutorial, it makes it easier to visualize the movement of data in the cluster.
2. Run the `ycsb` workload, pointing it at HAProxy's port:
```shell theme={"theme":{"light":"catppuccin-mocha","dark":"catppuccin-mocha"}}
$ cockroach workload run ycsb \
--duration=20m \
--concurrency=3 \
--max-rate=1000 \
--tolerate-errors \
'postgresql://root@localhost:26000?sslmode=disable'
```
This command initiates 3 concurrent client workloads for 20 minutes, but limits the total load to 1000 operations per second (since you're running everything on a single machine).
You'll see per-operation statistics print to standard output every second:
```
_elapsed___errors__ops/sec(inst)___ops/sec(cum)__p50(ms)__p95(ms)__p99(ms)_pMax(ms)
1.0s 0 902.8 930.9 1.1 2.1 4.1 62.9 read
1.0s 0 46.5 48.0 3.4 4.7 6.0 6.0 update
2.0s 0 923.3 926.9 1.0 2.9 5.5 8.9 read
2.0s 0 38.0 43.0 3.0 6.0 7.6 7.6 update
3.0s 0 901.1 918.3 1.1 2.5 5.0 6.6 read
3.0s 0 55.0 47.0 3.4 7.9 9.4 11.5 update
4.0s 0 948.9 926.0 1.0 1.6 2.6 5.0 read
4.0s 0 46.0 46.7 3.1 5.2 16.8 16.8 update
5.0s 0 932.0 927.2 1.1 1.8 2.9 13.6 read
5.0s 0 56.0 48.6 3.0 4.2 5.2 5.5 update
...
```
After the specified duration (20 minutes in this case), the workload will stop and you'll see totals printed to standard output.
### Step 4. Check the workload
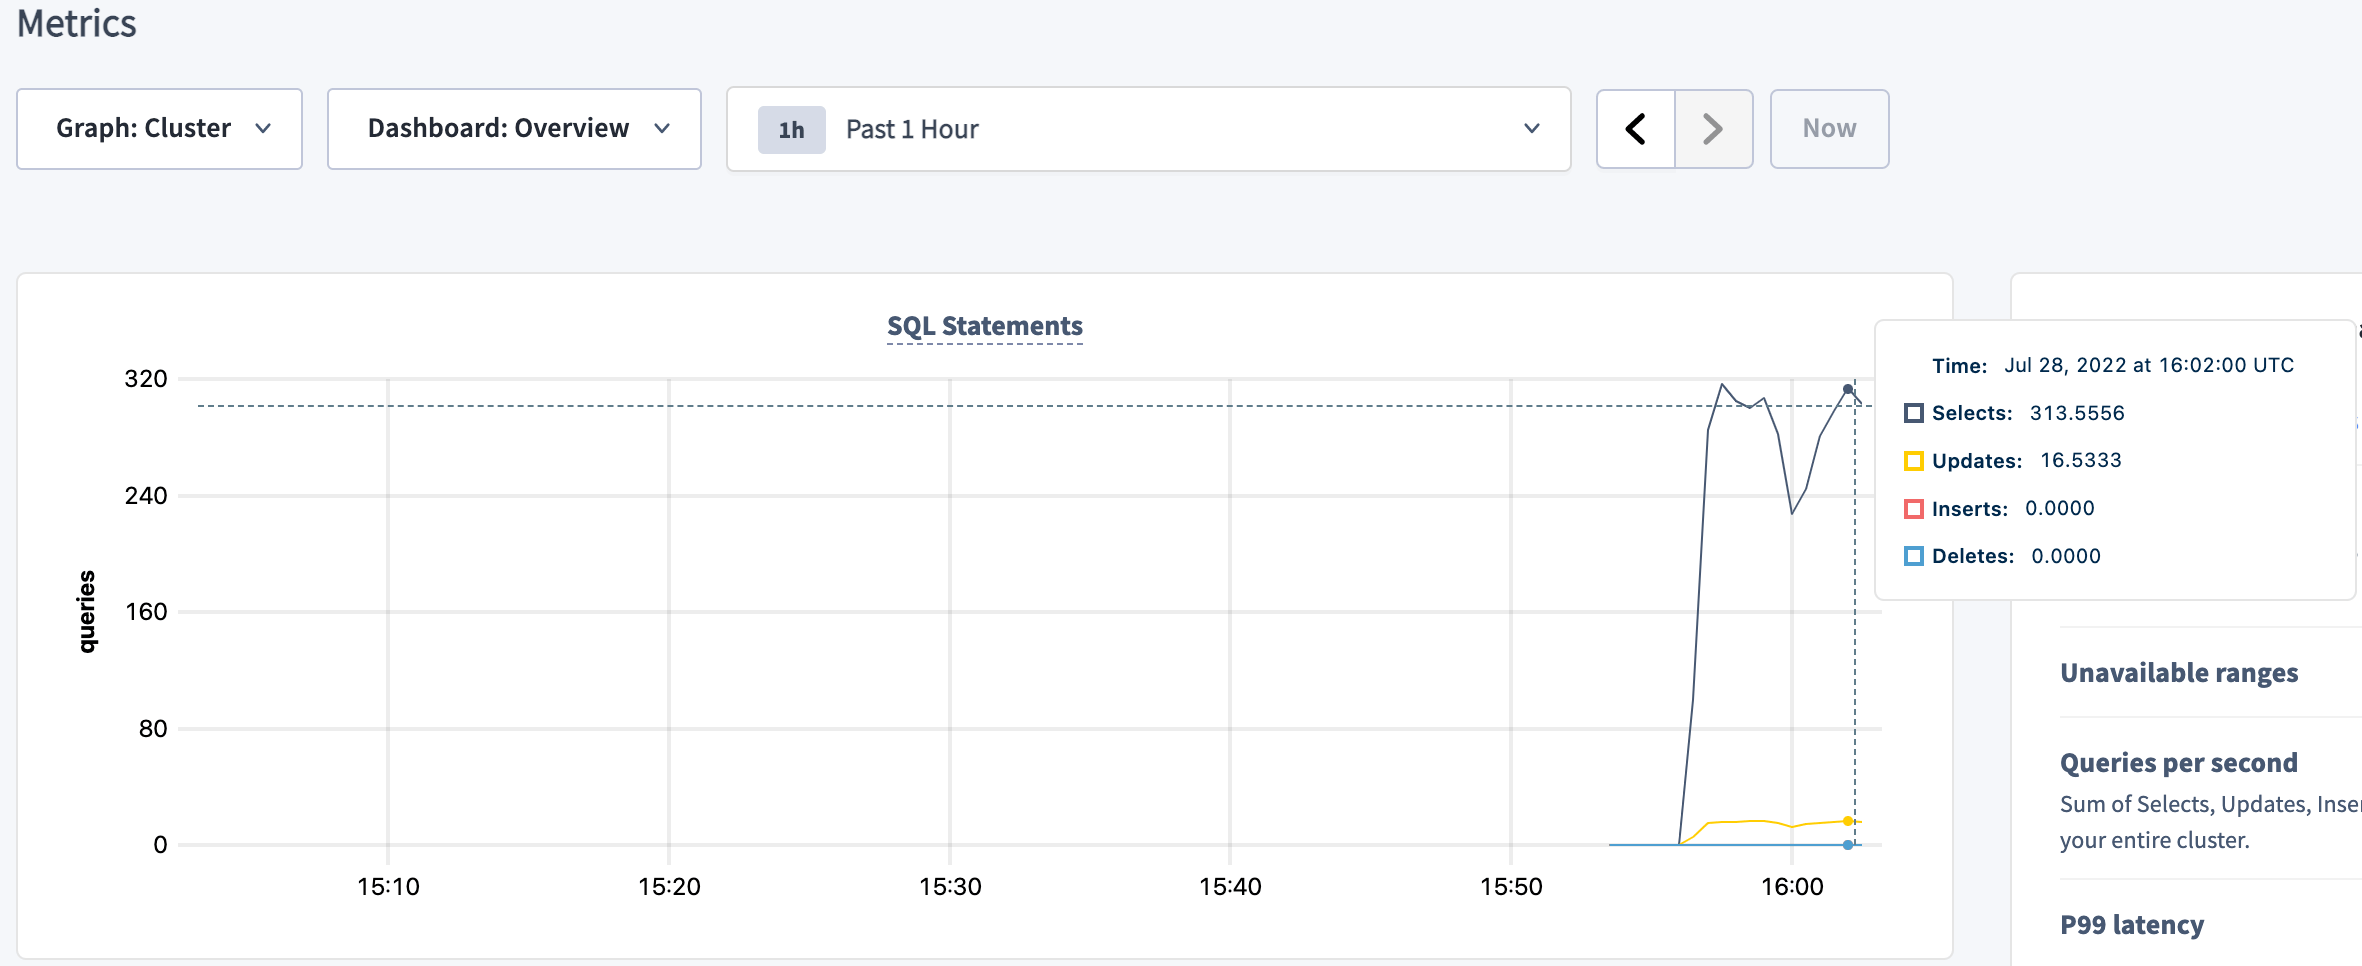
Initially, the workload creates a new database called `ycsb`, creates the table `public.usertable` in that database, and inserts rows into the table. Soon, the load generator starts executing approximately 95% reads and 5% writes.
1. Go to the DB Console at [http://localhost:8080](http://localhost:8080).
2. To check the SQL queries getting executed, click **Metrics** on the left, and hover over the **SQL Statements** graph at the top:
 3. To check the client connections from the load generator, select the **SQL** dashboard and hover over the **Open SQL Sessions** graph:
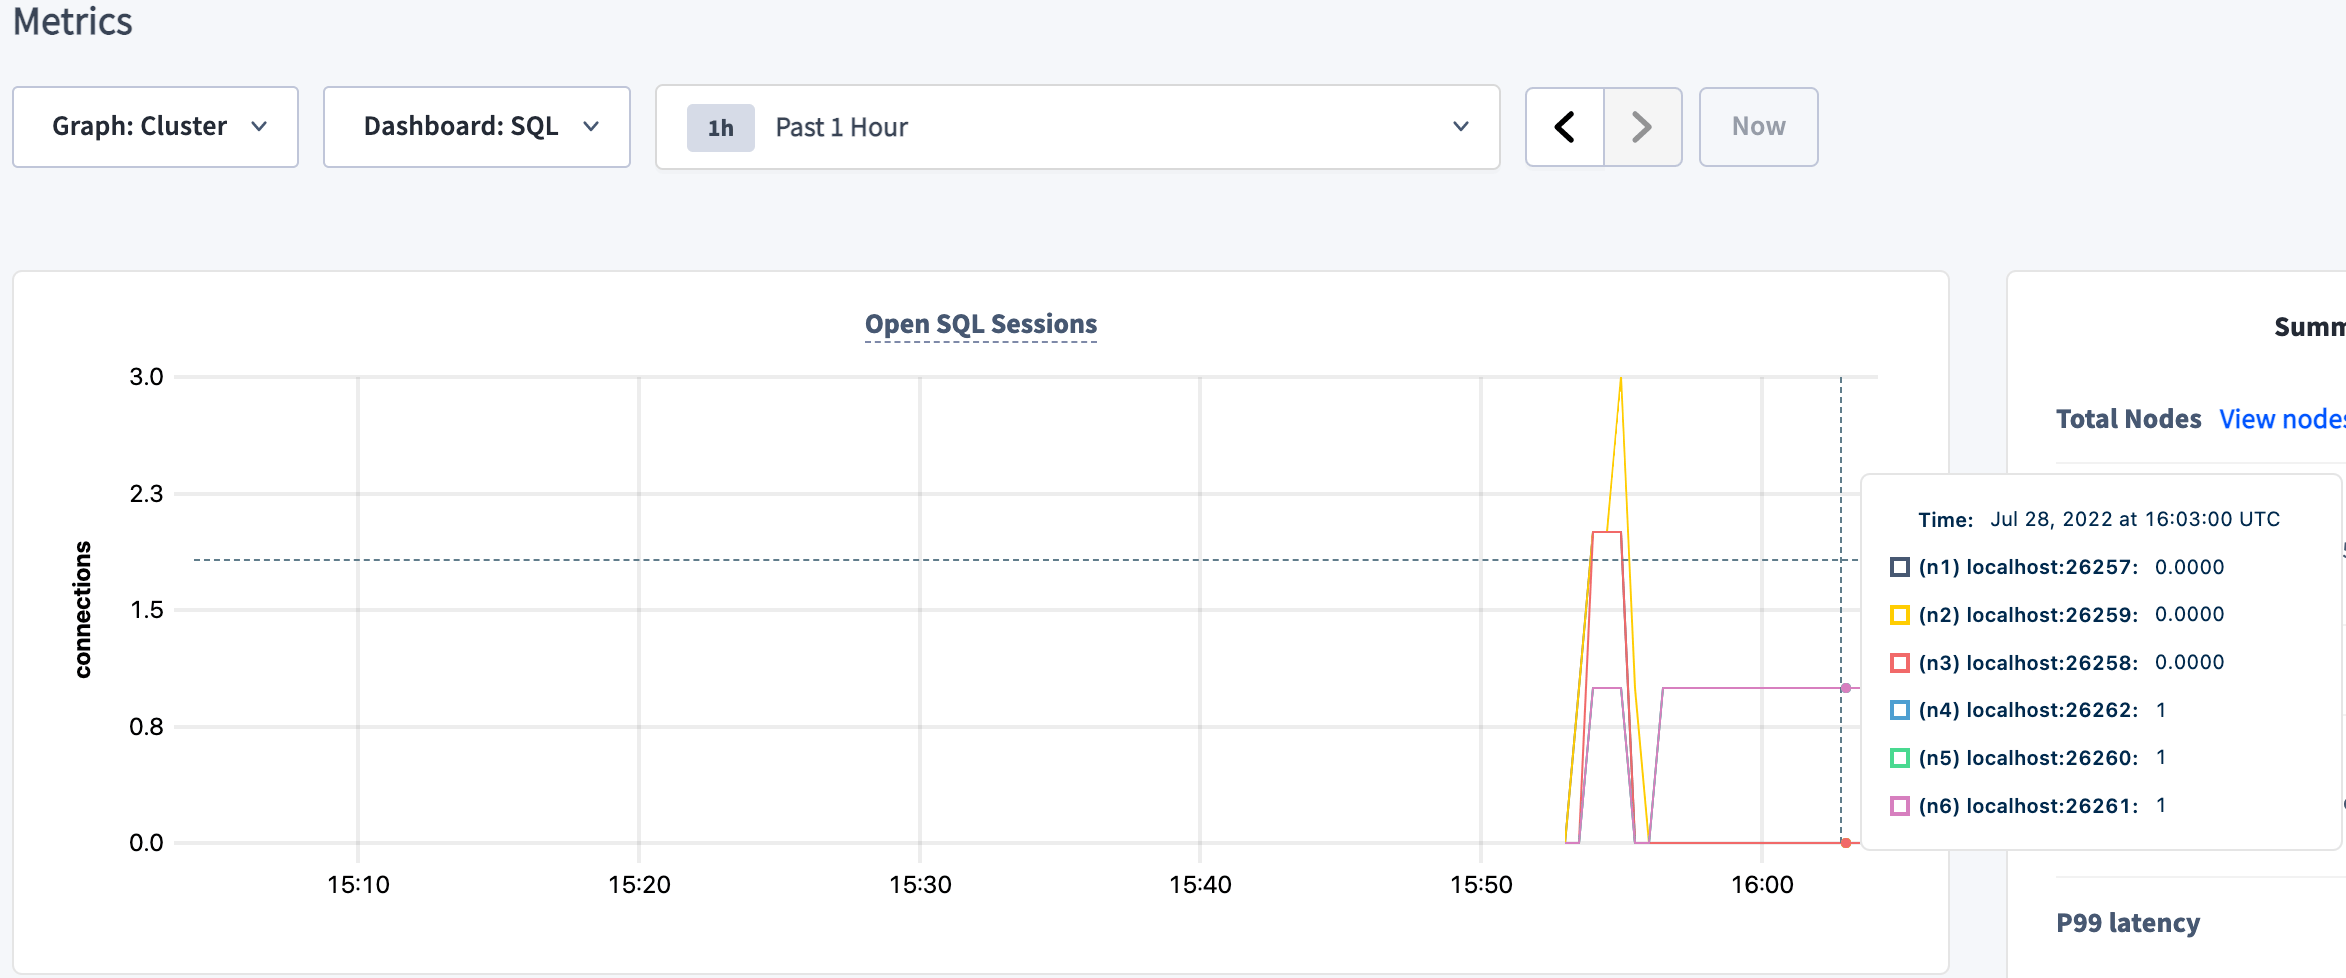 You'll notice 3 client connections from the load generator. If you want to check that HAProxy balanced each connection to a different node, you can change the **Graph** dropdown from **Cluster** to specific nodes.
4. To see more details about the `ycsb` database and the `public.usertable` table, click **Databases** in the upper left and click **ycsb**:
You'll notice 3 client connections from the load generator. If you want to check that HAProxy balanced each connection to a different node, you can change the **Graph** dropdown from **Cluster** to specific nodes.
4. To see more details about the `ycsb` database and the `public.usertable` table, click **Databases** in the upper left and click **ycsb**:
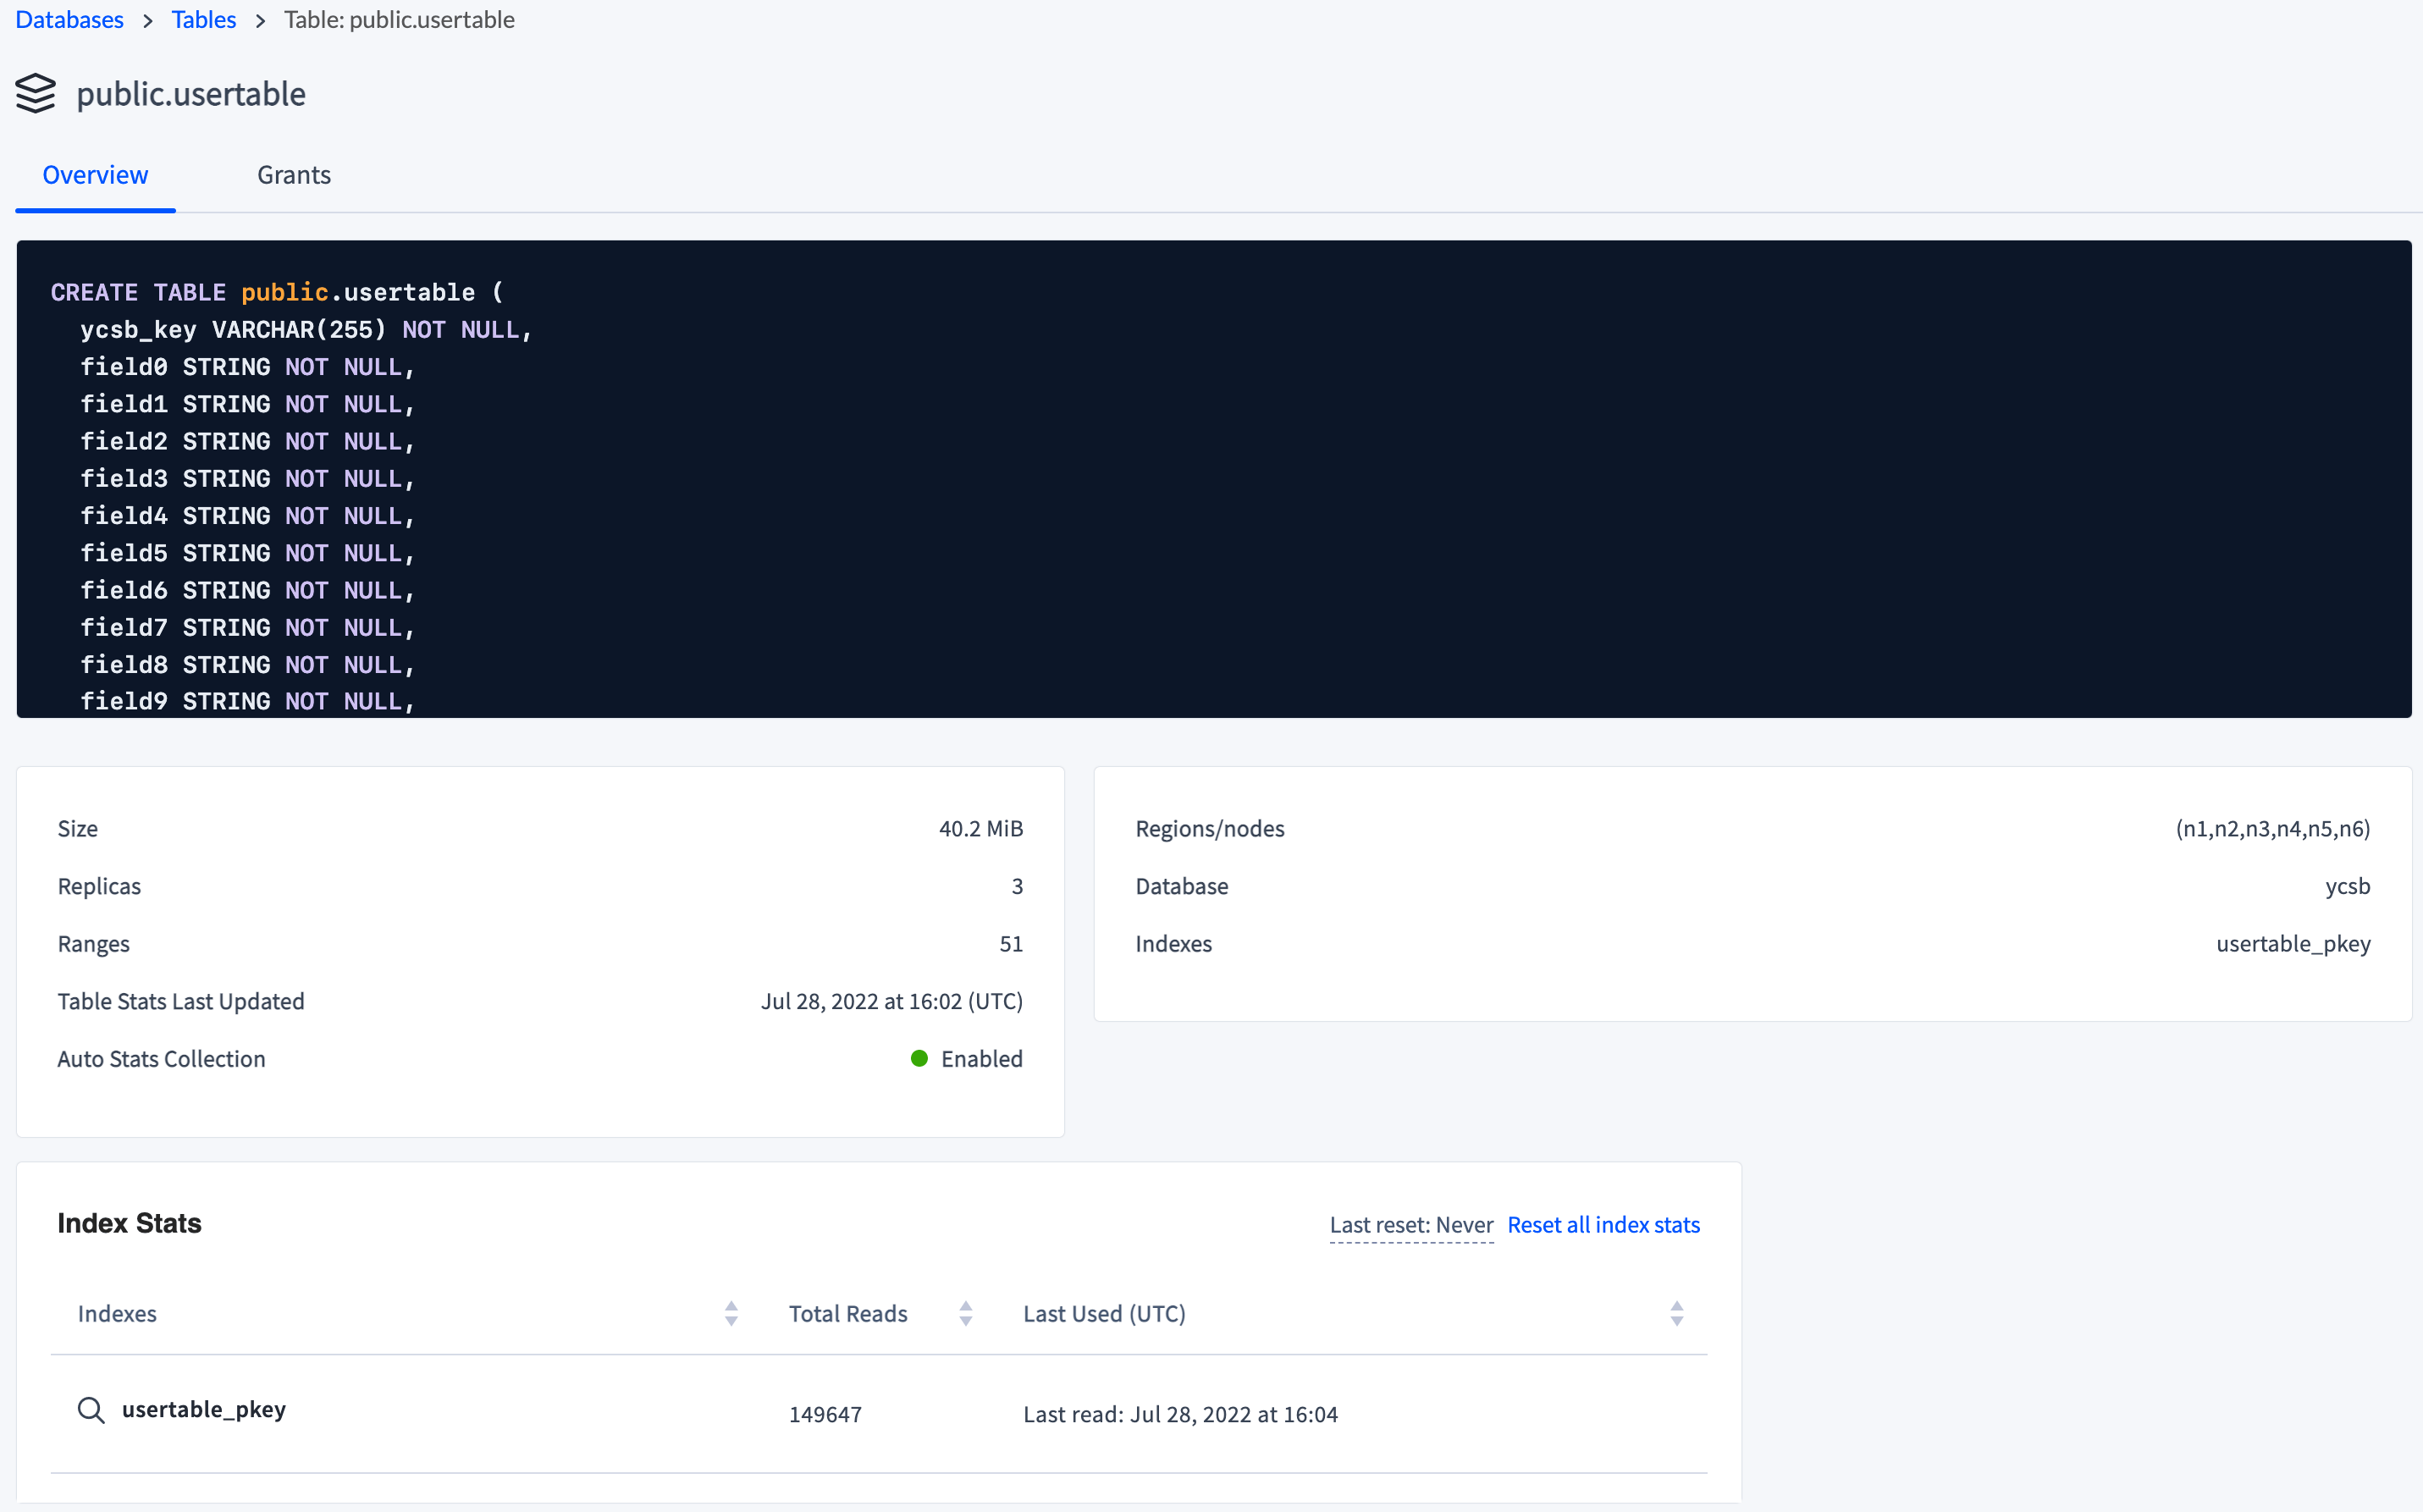
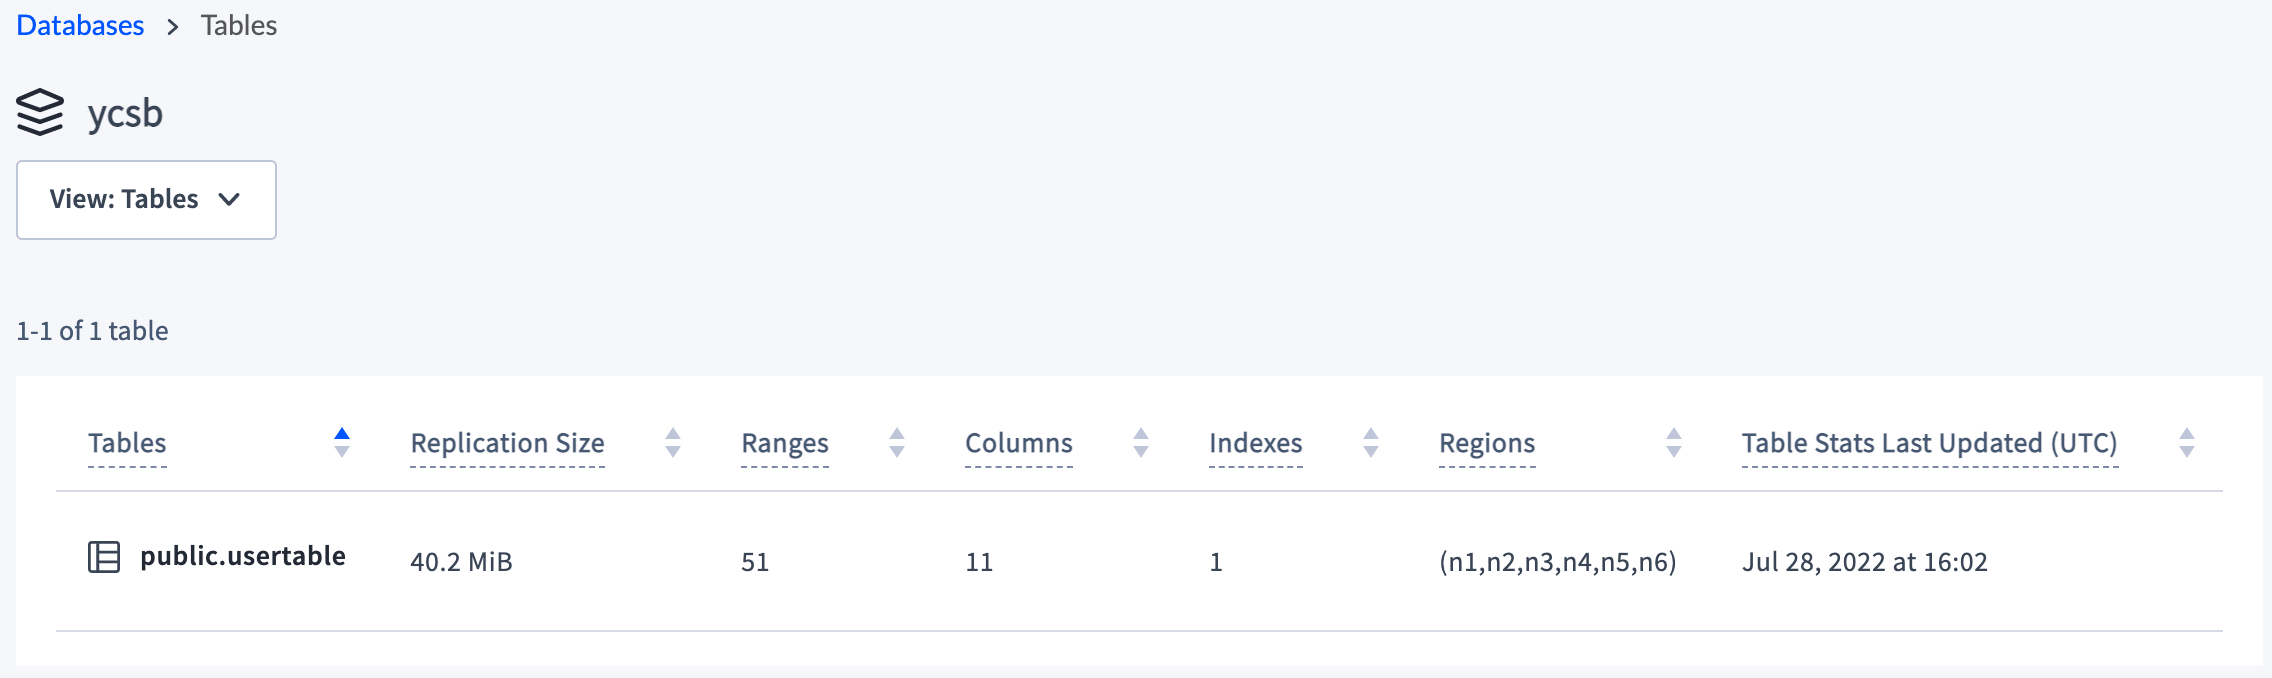 You can also view the schema and other table details of `public.usertable` by clicking the table name:
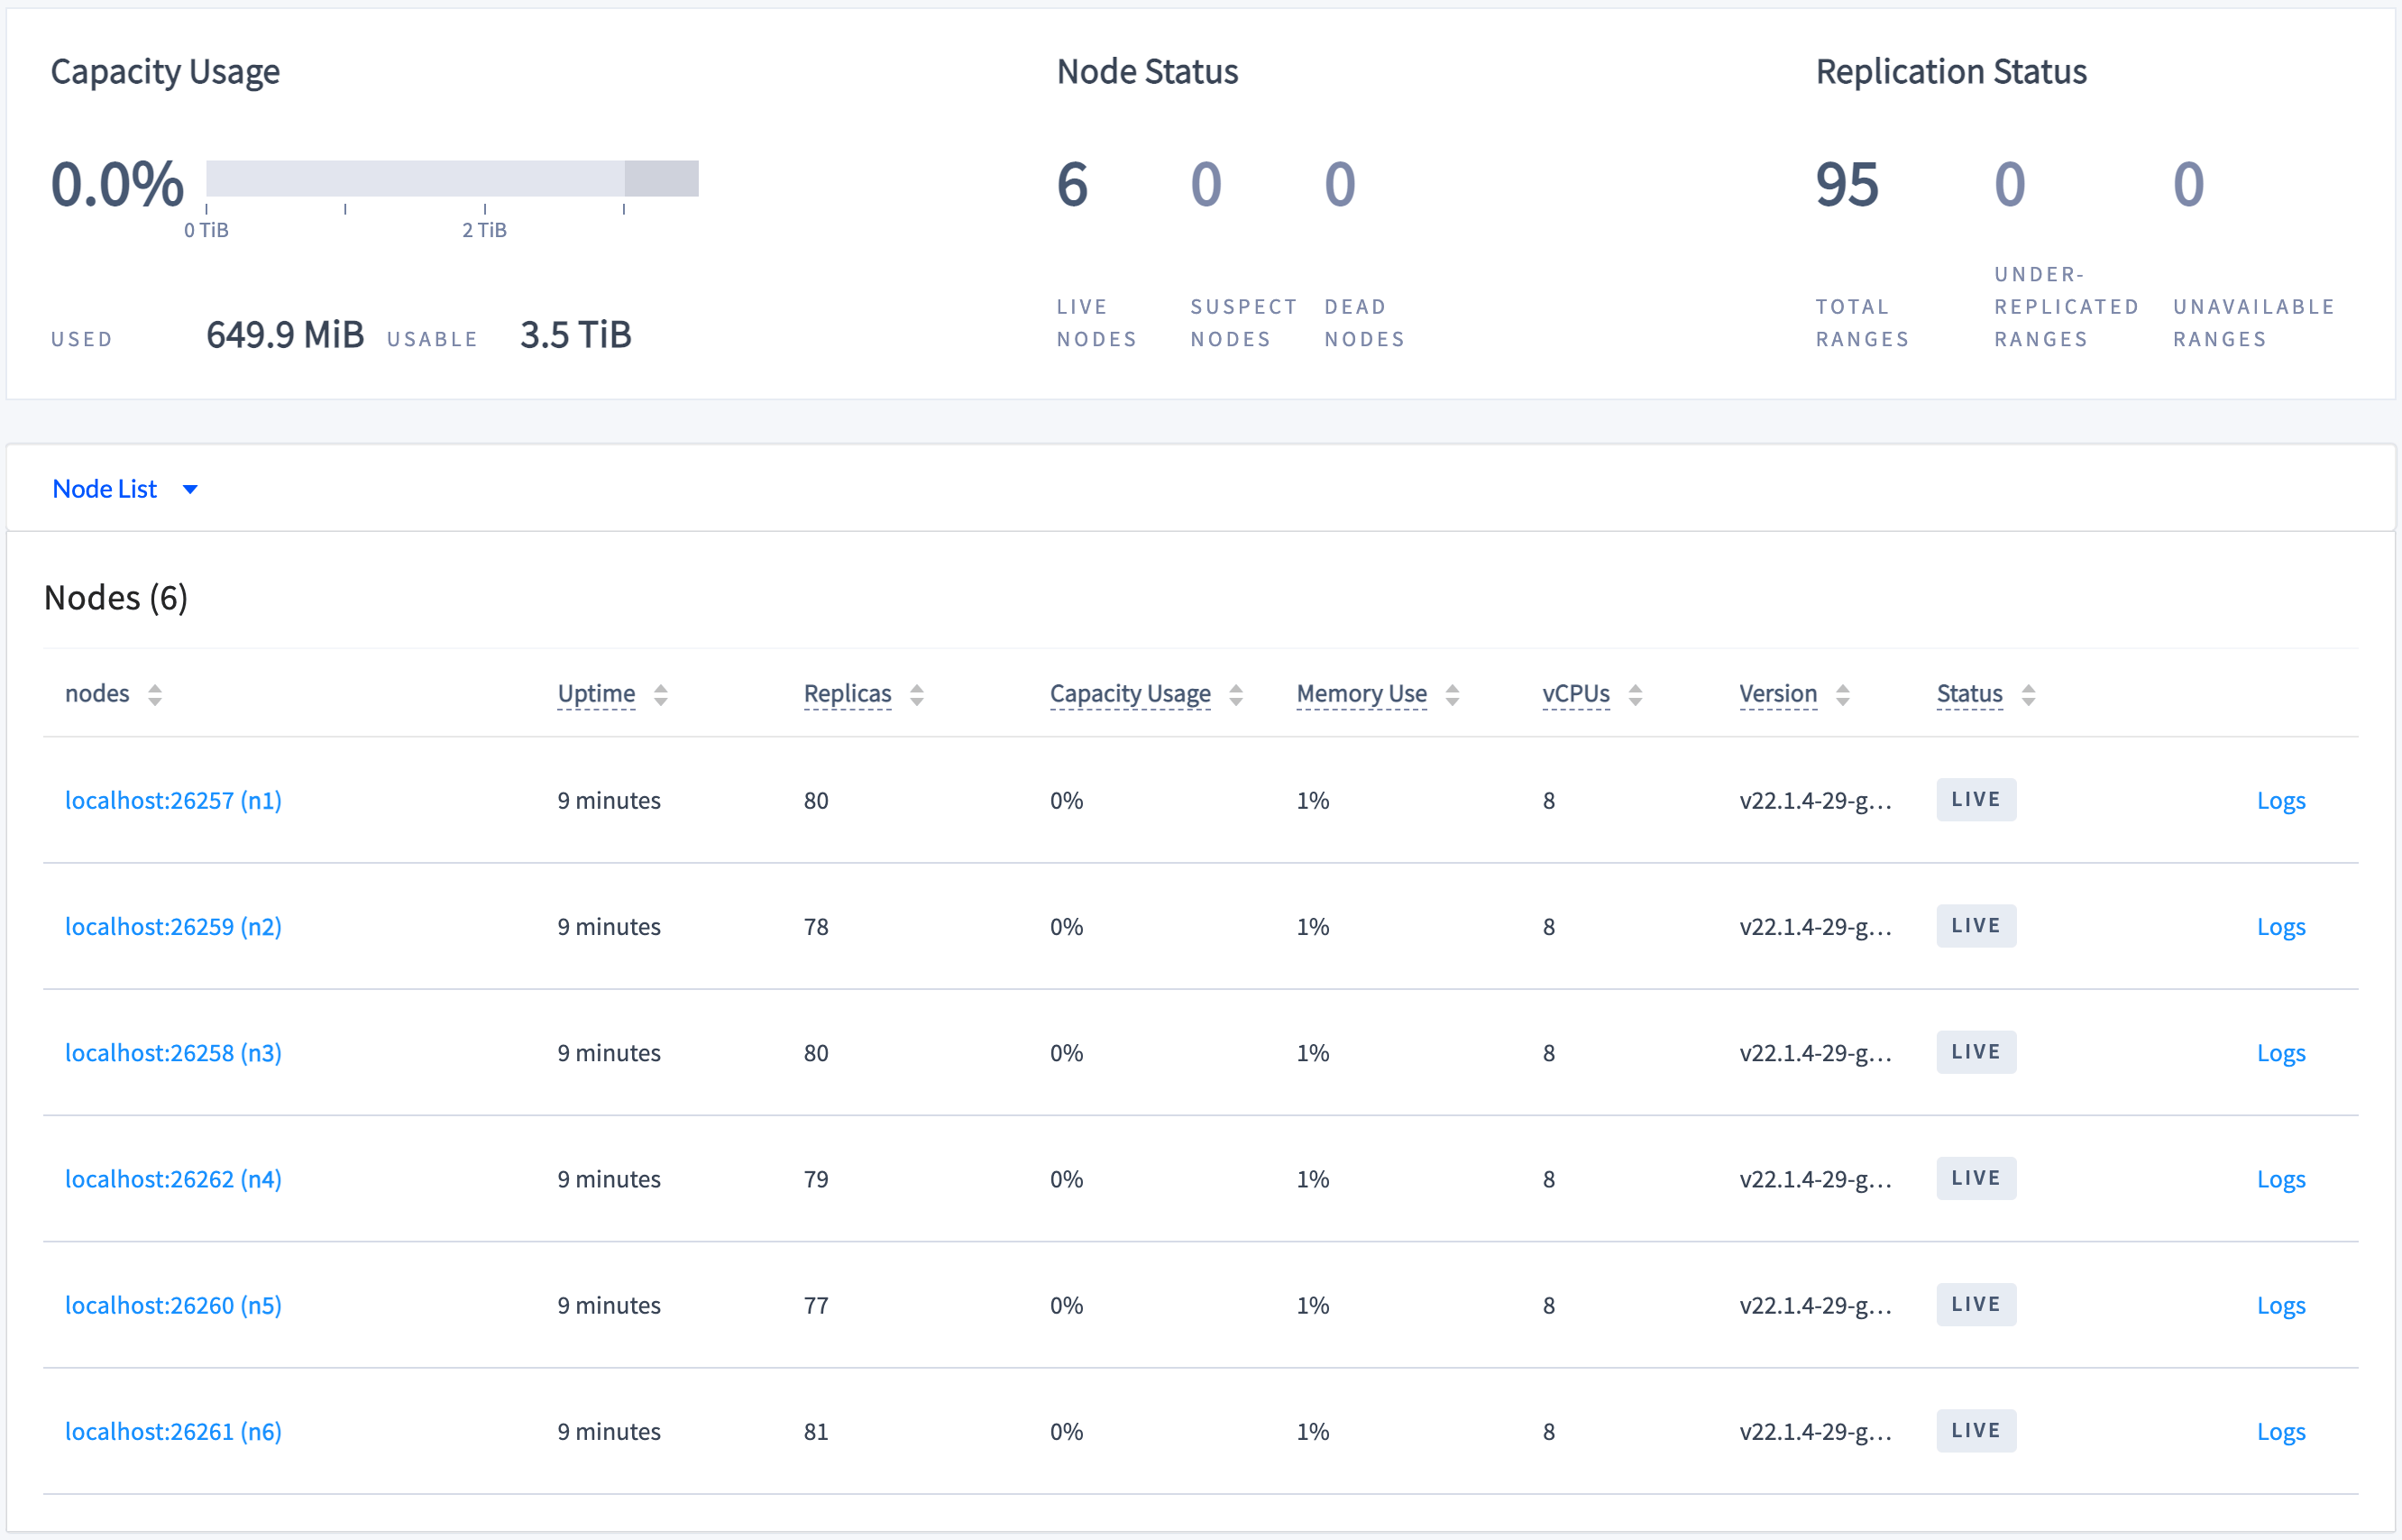
 5. By default, CockroachDB replicates all data 3 times and balances it across all nodes. To see this balance, click **Overview** and check the replica count across all nodes:
 ### Step 5. Simulate a single node failure
When a node fails, the cluster waits for the node to remain offline for 5 minutes by default before considering it dead, at which point the cluster automatically repairs itself by re-replicating any of the replicas on the down nodes to other available nodes.
1. In a new terminal, edit the default replication zone to reduce the amount of time the cluster waits before considering a node dead to the minimum allowed of 1 minute and 15 seconds:
```shell theme={"theme":{"light":"catppuccin-mocha","dark":"catppuccin-mocha"}}
$ cockroach sql --insecure --host=localhost:26000 \
--execute="SET CLUSTER SETTING server.time_until_store_dead = '1m15s';"
```
2. Get the process IDs of the nodes:
```shell theme={"theme":{"light":"catppuccin-mocha","dark":"catppuccin-mocha"}}
ps -ef | grep cockroach | grep -v grep
```
```
503 53645 1 0 10:18AM ttys013 0:44.80 cockroach start --insecure --store=fault-node1 --listen-addr=localhost:26257 --http-addr=localhost:8080 --join=localhost:26257,localhost:26258,localhost:26259
503 53651 1 0 10:18AM ttys013 0:38.81 cockroach start --insecure --store=fault-node2 --listen-addr=localhost:26258 --http-addr=localhost:8081 --join=localhost:26257,localhost:26258,localhost:26259
503 53671 1 0 10:18AM ttys013 0:35.40 cockroach start --insecure --store=fault-node3 --listen-addr=localhost:26259 --http-addr=localhost:8082 --join=localhost:26257,localhost:26258,localhost:26259
503 53684 1 0 10:18AM ttys013 0:38.44 cockroach start --insecure --store=fault-node4 --listen-addr=localhost:26260 --http-addr=localhost:8083 --join=localhost:26257,localhost:26258,localhost:26259
503 53708 1 0 10:18AM ttys013 0:39.49 cockroach start --insecure --store=fault-node5 --listen-addr=localhost:26261 --http-addr=localhost:8084 --join=localhost:26257,localhost:26258,localhost:26259
503 53730 1 0 10:18AM ttys013 0:33.37 cockroach start --insecure --store=fault-node6 --listen-addr=localhost:26262 --http-addr=localhost:8085 --join=localhost:26257,localhost:26258,localhost:26259
```
3. Gracefully shut down the node stored in `fault-node5`, specifying its process ID (in this example, `53708`):
```shell theme={"theme":{"light":"catppuccin-mocha","dark":"catppuccin-mocha"}}
kill -TERM 53708
```
### Step 6. Check load continuity and cluster health
Go back to the DB Console, click **Metrics** on the left, and verify that the cluster as a whole continues serving data, despite one of the nodes being unavailable and marked as **Suspect**:
### Step 5. Simulate a single node failure
When a node fails, the cluster waits for the node to remain offline for 5 minutes by default before considering it dead, at which point the cluster automatically repairs itself by re-replicating any of the replicas on the down nodes to other available nodes.
1. In a new terminal, edit the default replication zone to reduce the amount of time the cluster waits before considering a node dead to the minimum allowed of 1 minute and 15 seconds:
```shell theme={"theme":{"light":"catppuccin-mocha","dark":"catppuccin-mocha"}}
$ cockroach sql --insecure --host=localhost:26000 \
--execute="SET CLUSTER SETTING server.time_until_store_dead = '1m15s';"
```
2. Get the process IDs of the nodes:
```shell theme={"theme":{"light":"catppuccin-mocha","dark":"catppuccin-mocha"}}
ps -ef | grep cockroach | grep -v grep
```
```
503 53645 1 0 10:18AM ttys013 0:44.80 cockroach start --insecure --store=fault-node1 --listen-addr=localhost:26257 --http-addr=localhost:8080 --join=localhost:26257,localhost:26258,localhost:26259
503 53651 1 0 10:18AM ttys013 0:38.81 cockroach start --insecure --store=fault-node2 --listen-addr=localhost:26258 --http-addr=localhost:8081 --join=localhost:26257,localhost:26258,localhost:26259
503 53671 1 0 10:18AM ttys013 0:35.40 cockroach start --insecure --store=fault-node3 --listen-addr=localhost:26259 --http-addr=localhost:8082 --join=localhost:26257,localhost:26258,localhost:26259
503 53684 1 0 10:18AM ttys013 0:38.44 cockroach start --insecure --store=fault-node4 --listen-addr=localhost:26260 --http-addr=localhost:8083 --join=localhost:26257,localhost:26258,localhost:26259
503 53708 1 0 10:18AM ttys013 0:39.49 cockroach start --insecure --store=fault-node5 --listen-addr=localhost:26261 --http-addr=localhost:8084 --join=localhost:26257,localhost:26258,localhost:26259
503 53730 1 0 10:18AM ttys013 0:33.37 cockroach start --insecure --store=fault-node6 --listen-addr=localhost:26262 --http-addr=localhost:8085 --join=localhost:26257,localhost:26258,localhost:26259
```
3. Gracefully shut down the node stored in `fault-node5`, specifying its process ID (in this example, `53708`):
```shell theme={"theme":{"light":"catppuccin-mocha","dark":"catppuccin-mocha"}}
kill -TERM 53708
```
### Step 6. Check load continuity and cluster health
Go back to the DB Console, click **Metrics** on the left, and verify that the cluster as a whole continues serving data, despite one of the nodes being unavailable and marked as **Suspect**:
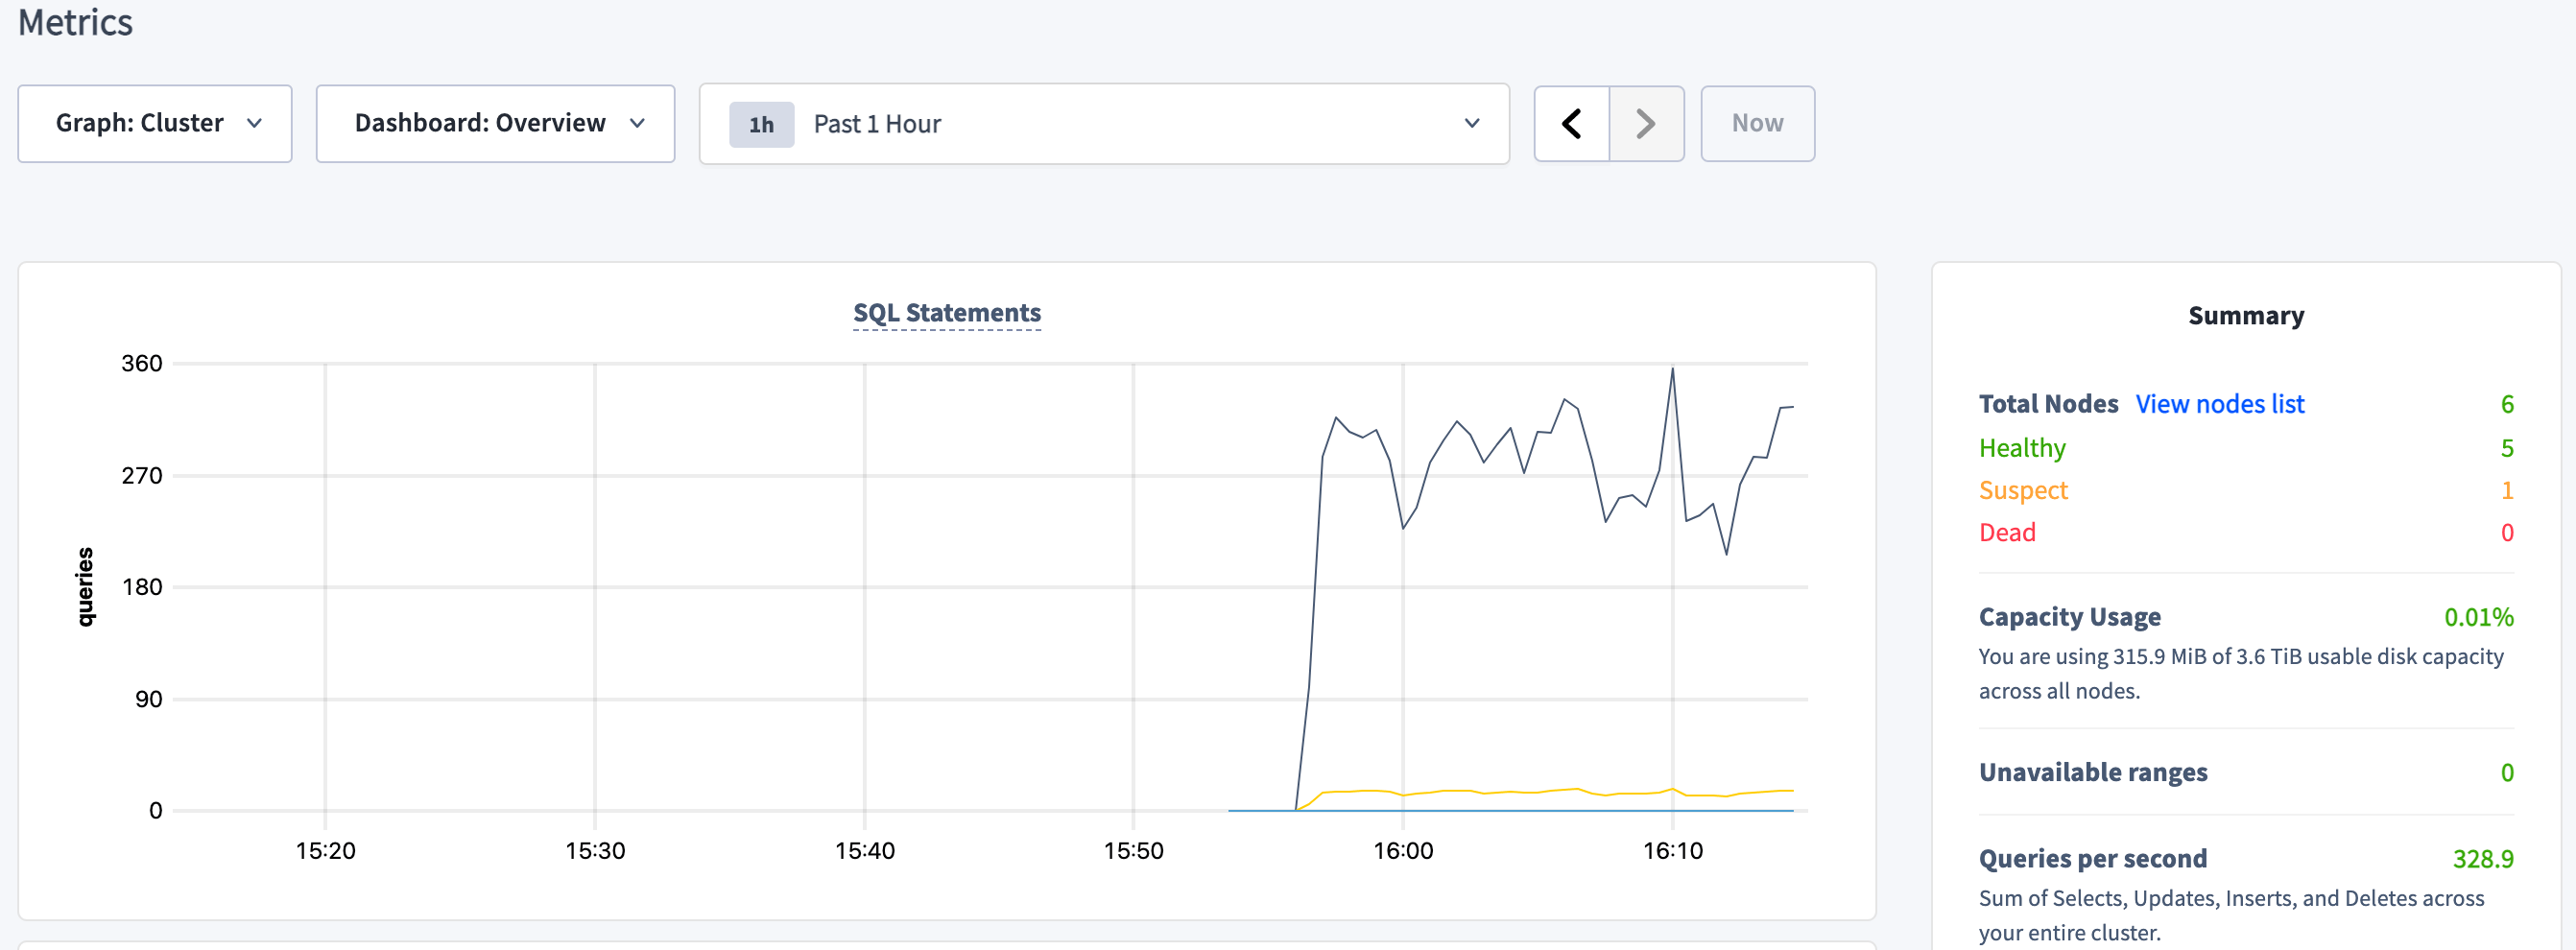 This shows that when all ranges are replicated 3 times (the default), the cluster can tolerate a single node failure because the surviving nodes have a majority of each range's replicas (2/3).
### Step 7. Watch the cluster repair itself
Click **Overview** on the left:
This shows that when all ranges are replicated 3 times (the default), the cluster can tolerate a single node failure because the surviving nodes have a majority of each range's replicas (2/3).
### Step 7. Watch the cluster repair itself
Click **Overview** on the left:
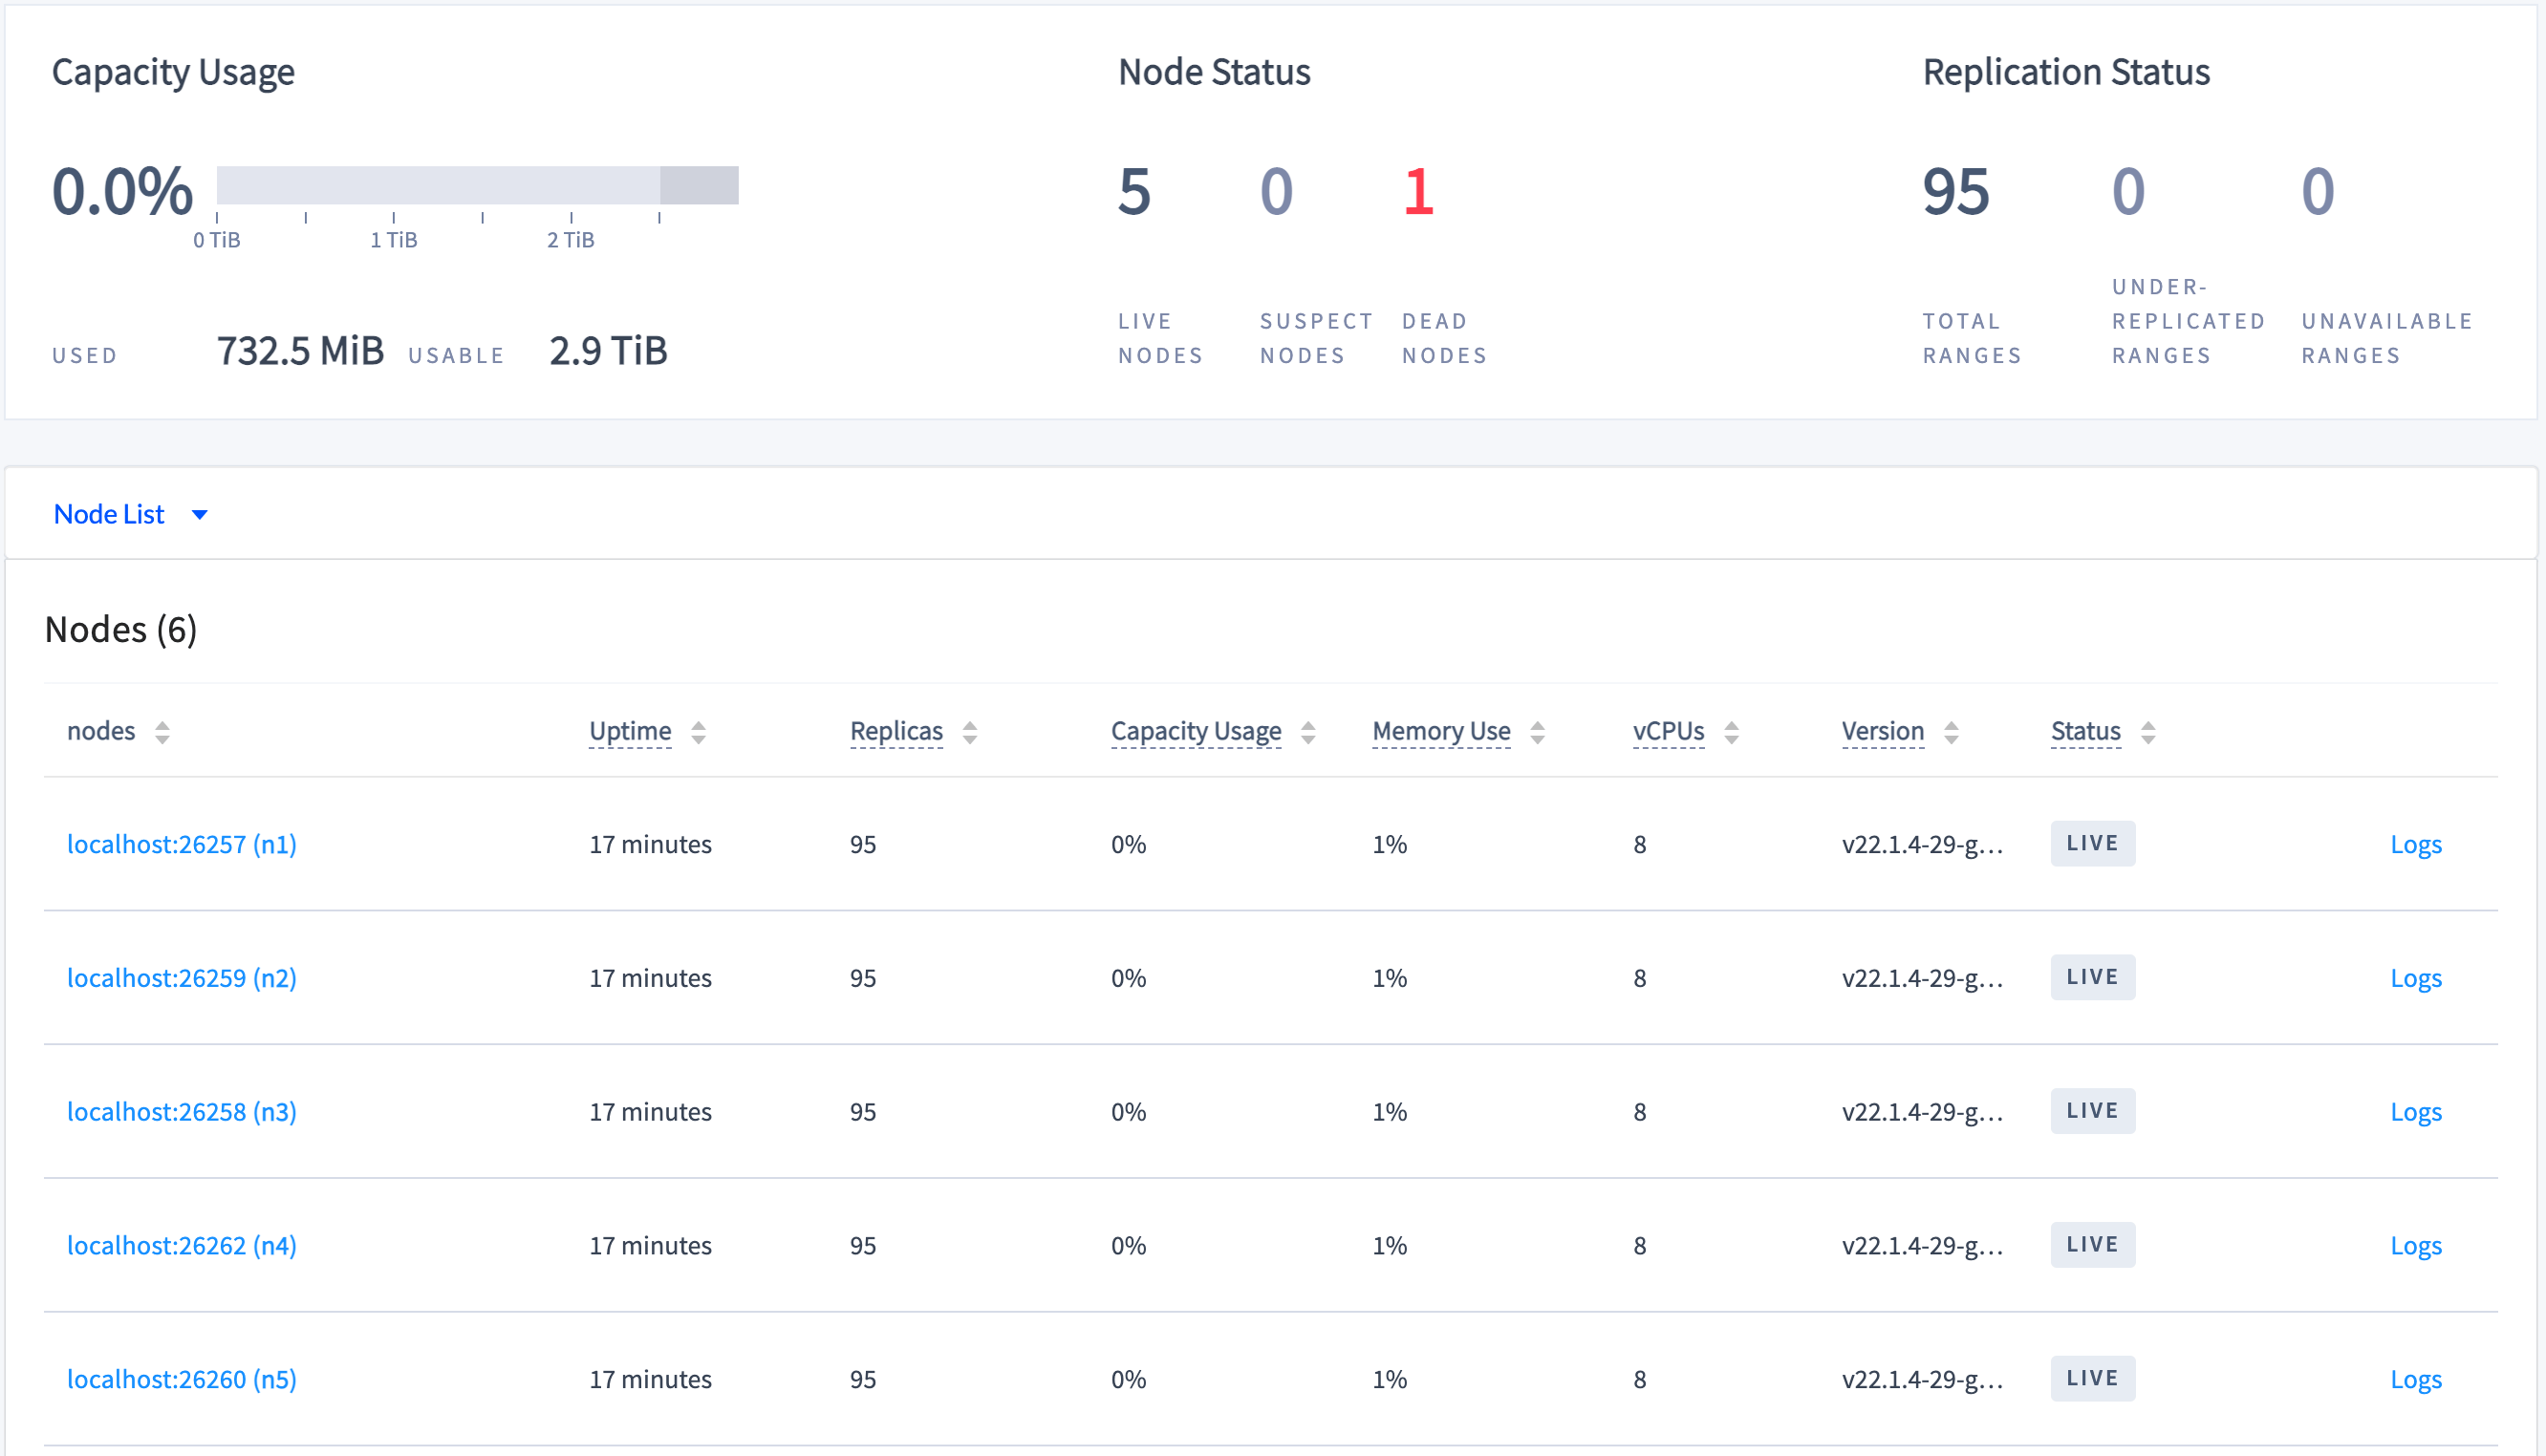 Because you reduced the time it takes for the cluster to consider the down node dead, after 1 minute or so, the cluster will consider the down node "dead", and you'll see the replica count on the remaining nodes increase and the number of under-replicated ranges decrease to 0. This shows the cluster repairing itself by re-replicating missing replicas.
### Step 8. Prepare for two simultaneous node failures
At this point, the cluster has recovered and is ready to handle another failure. However, the cluster cannot handle two *near-simultaneous* failures in this configuration. Failures are "near-simultaneous" if they are closer together than the `server.time_until_store_dead` cluster setting plus the time taken for the number of replicas on the dead node to drop to zero. If two failures occurred in this configuration, some ranges would become unavailable until one of the nodes recovers.
To be able to tolerate 2 of 5 nodes failing simultaneously without any service interruption, ranges must be replicated 5 times.
1. In the terminal window where you started `fault-node5` initially, start it again using the same command you used to [start the node initially](#step-1-start-a-6-node-cluster):
```shell theme={"theme":{"light":"catppuccin-mocha","dark":"catppuccin-mocha"}}
$ cockroach start \
--insecure \
--store=fault-node5 \
--listen-addr=localhost:26261 \
--http-addr=localhost:8084 \
--join=localhost:26257,localhost:26258,localhost:26259
```
2. Use the `ALTER RANGE ... CONFIGURE ZONE` command to change the cluster's `default` replication factor to 5:
```shell theme={"theme":{"light":"catppuccin-mocha","dark":"catppuccin-mocha"}}
$ cockroach sql --insecure --host=localhost:26000 \
--execute="ALTER RANGE default CONFIGURE ZONE USING num_replicas=5;"
```
3. In the DB Console **Overview** dashboard, watch the replica count increase and even out across all 6 nodes:
Because you reduced the time it takes for the cluster to consider the down node dead, after 1 minute or so, the cluster will consider the down node "dead", and you'll see the replica count on the remaining nodes increase and the number of under-replicated ranges decrease to 0. This shows the cluster repairing itself by re-replicating missing replicas.
### Step 8. Prepare for two simultaneous node failures
At this point, the cluster has recovered and is ready to handle another failure. However, the cluster cannot handle two *near-simultaneous* failures in this configuration. Failures are "near-simultaneous" if they are closer together than the `server.time_until_store_dead` cluster setting plus the time taken for the number of replicas on the dead node to drop to zero. If two failures occurred in this configuration, some ranges would become unavailable until one of the nodes recovers.
To be able to tolerate 2 of 5 nodes failing simultaneously without any service interruption, ranges must be replicated 5 times.
1. In the terminal window where you started `fault-node5` initially, start it again using the same command you used to [start the node initially](#step-1-start-a-6-node-cluster):
```shell theme={"theme":{"light":"catppuccin-mocha","dark":"catppuccin-mocha"}}
$ cockroach start \
--insecure \
--store=fault-node5 \
--listen-addr=localhost:26261 \
--http-addr=localhost:8084 \
--join=localhost:26257,localhost:26258,localhost:26259
```
2. Use the `ALTER RANGE ... CONFIGURE ZONE` command to change the cluster's `default` replication factor to 5:
```shell theme={"theme":{"light":"catppuccin-mocha","dark":"catppuccin-mocha"}}
$ cockroach sql --insecure --host=localhost:26000 \
--execute="ALTER RANGE default CONFIGURE ZONE USING num_replicas=5;"
```
3. In the DB Console **Overview** dashboard, watch the replica count increase and even out across all 6 nodes:
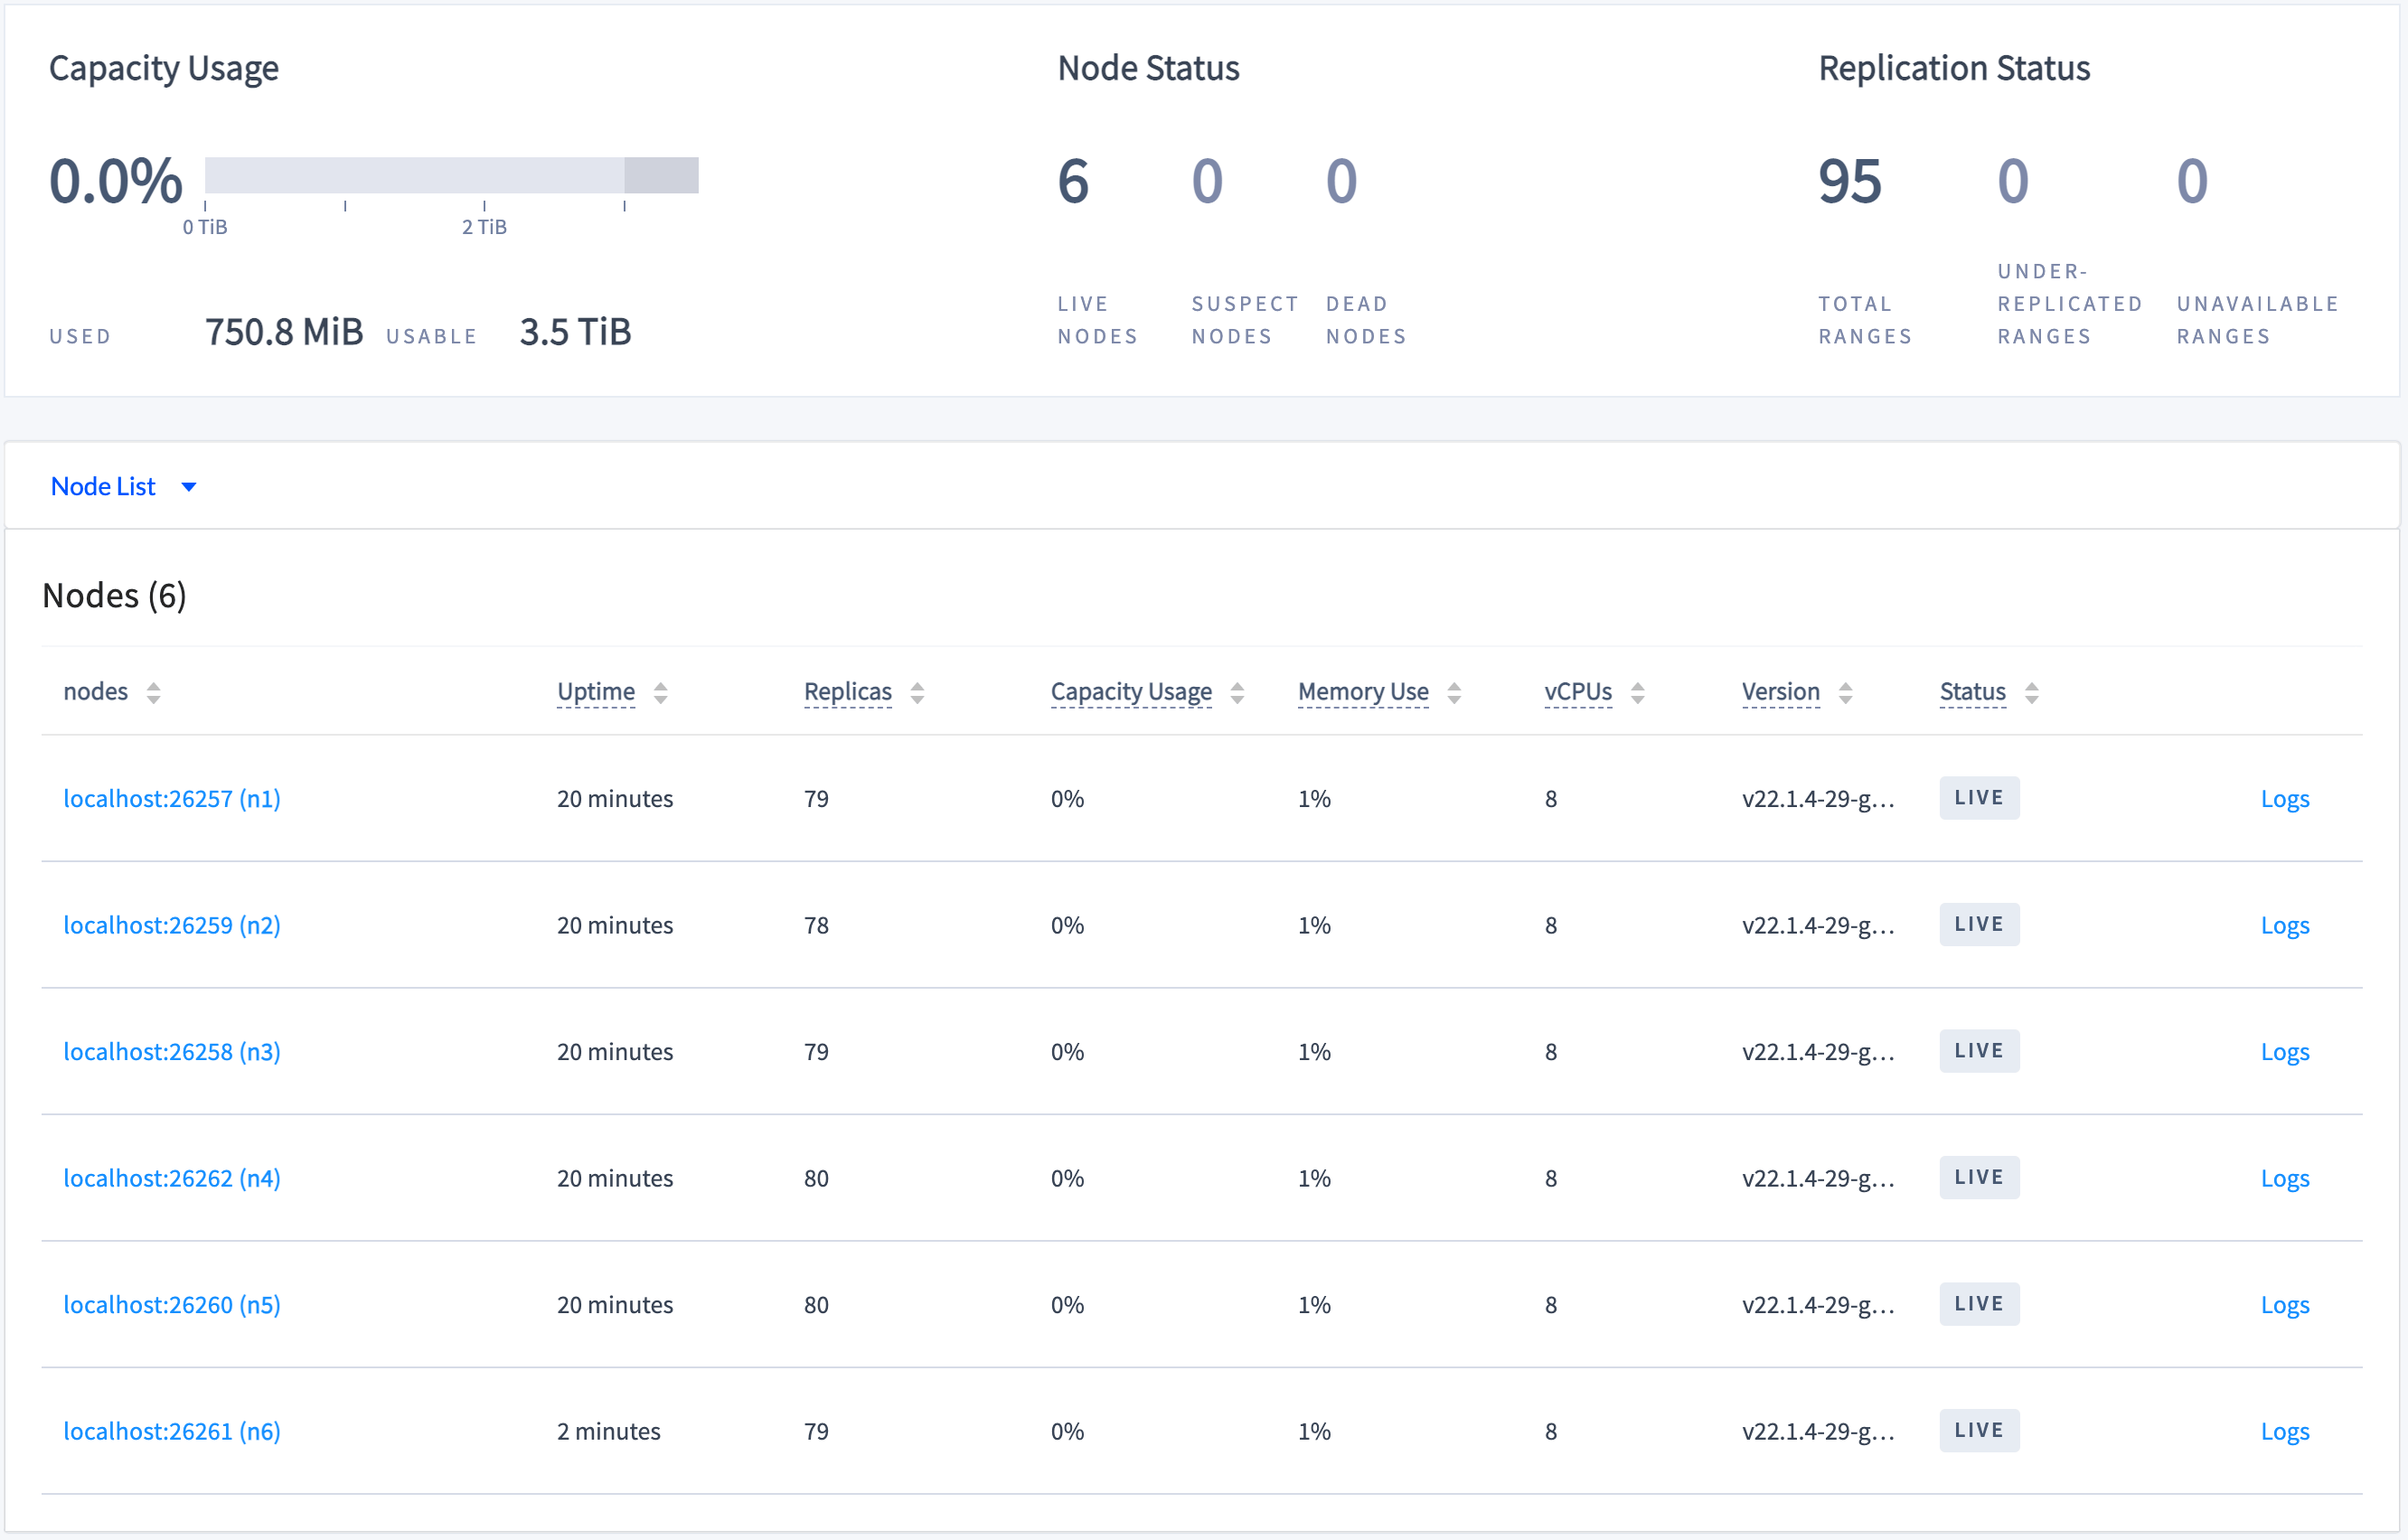 This shows the cluster up-replicating so that each range has 5 replicas, one on each node.
### Step 9. Simulate two simultaneous node failures
Gracefully shut down **2 nodes**, specifying the [process IDs you retrieved earlier](#step-5-simulate-a-single-node-failure):
```shell theme={"theme":{"light":"catppuccin-mocha","dark":"catppuccin-mocha"}}
kill -TERM {process IDs}
```
### Step 10. Check cluster status and service continuity
1. Click **Overview** on the left, and verify the state of the cluster:
This shows the cluster up-replicating so that each range has 5 replicas, one on each node.
### Step 9. Simulate two simultaneous node failures
Gracefully shut down **2 nodes**, specifying the [process IDs you retrieved earlier](#step-5-simulate-a-single-node-failure):
```shell theme={"theme":{"light":"catppuccin-mocha","dark":"catppuccin-mocha"}}
kill -TERM {process IDs}
```
### Step 10. Check cluster status and service continuity
1. Click **Overview** on the left, and verify the state of the cluster:
 2. To verify that the cluster still serves data, use the `cockroach sql` command to interact with the cluster.
Count the number of rows in the `ycsb.public.usertable` table to see that it serves reads:
```shell theme={"theme":{"light":"catppuccin-mocha","dark":"catppuccin-mocha"}}
$ cockroach sql --insecure --host=localhost:26257 \
--execute="SELECT count(*) FROM ycsb.public.usertable;"
```
```
count
+-------+
10000
(1 row)
```
Insert data to see that it serves writes:
```shell theme={"theme":{"light":"catppuccin-mocha","dark":"catppuccin-mocha"}}
$ cockroach sql --insecure --host=localhost:26257 \
--execute="INSERT INTO ycsb.public.usertable VALUES ('asdf', NULL, NULL, NULL, NULL, NULL, NULL, NULL, NULL, NULL, NULL);"
```
```shell theme={"theme":{"light":"catppuccin-mocha","dark":"catppuccin-mocha"}}
$ cockroach sql --insecure --host=localhost:26257 \
--execute="SELECT count(*) FROM ycsb.public.usertable;"
```
```
count
+-------+
10001
(1 row)
```
This shows that when all ranges are replicated 5 times, the cluster can tolerate 2 simultaneous node outages because the surviving nodes have a majority of each range's replicas (3/5).
### Step 11. Clean up
1. In the terminal where the YCSB workload is running, press **CTRL + c**.
2. Terminate HAProxy:
```shell theme={"theme":{"light":"catppuccin-mocha","dark":"catppuccin-mocha"}}
$ pkill haproxy
```
3. Gracefully shut down the remaining **4 nodes**, specifying the [process IDs you retrieved earlier](#step-5-simulate-a-single-node-failure) and the new process ID for the node stored in `fault-node5`:
```shell theme={"theme":{"light":"catppuccin-mocha","dark":"catppuccin-mocha"}}
kill -TERM {process IDs}
```
For the final 2 nodes, the shutdown process will take longer (about a minute each) and will eventually force the nodes to stop. This is because, with only 2 of 5 nodes left, a majority of replicas are not available, and so the cluster is no longer operational.
1. To restart the cluster at a later time, run the same `cockroach start` commands as in [Step 1. Start a 6-node cluster](#step-1-start-a-6-node-cluster) from the directory containing the nodes' data stores.
2. If you do not plan to restart the cluster, you may want to remove the nodes' data stores and the HAProxy config files:
```shell theme={"theme":{"light":"catppuccin-mocha","dark":"catppuccin-mocha"}}
$ rm -rf fault-node1 fault-node2 fault-node3 fault-node4 fault-node5 fault-node6 haproxy.cfg haproxy.cfg.saved
```
## What's next?
Explore other CockroachDB benefits and features:
* Replication & Rebalancing
* CockroachDB Resilience
* Serializable Transactions
2. To verify that the cluster still serves data, use the `cockroach sql` command to interact with the cluster.
Count the number of rows in the `ycsb.public.usertable` table to see that it serves reads:
```shell theme={"theme":{"light":"catppuccin-mocha","dark":"catppuccin-mocha"}}
$ cockroach sql --insecure --host=localhost:26257 \
--execute="SELECT count(*) FROM ycsb.public.usertable;"
```
```
count
+-------+
10000
(1 row)
```
Insert data to see that it serves writes:
```shell theme={"theme":{"light":"catppuccin-mocha","dark":"catppuccin-mocha"}}
$ cockroach sql --insecure --host=localhost:26257 \
--execute="INSERT INTO ycsb.public.usertable VALUES ('asdf', NULL, NULL, NULL, NULL, NULL, NULL, NULL, NULL, NULL, NULL);"
```
```shell theme={"theme":{"light":"catppuccin-mocha","dark":"catppuccin-mocha"}}
$ cockroach sql --insecure --host=localhost:26257 \
--execute="SELECT count(*) FROM ycsb.public.usertable;"
```
```
count
+-------+
10001
(1 row)
```
This shows that when all ranges are replicated 5 times, the cluster can tolerate 2 simultaneous node outages because the surviving nodes have a majority of each range's replicas (3/5).
### Step 11. Clean up
1. In the terminal where the YCSB workload is running, press **CTRL + c**.
2. Terminate HAProxy:
```shell theme={"theme":{"light":"catppuccin-mocha","dark":"catppuccin-mocha"}}
$ pkill haproxy
```
3. Gracefully shut down the remaining **4 nodes**, specifying the [process IDs you retrieved earlier](#step-5-simulate-a-single-node-failure) and the new process ID for the node stored in `fault-node5`:
```shell theme={"theme":{"light":"catppuccin-mocha","dark":"catppuccin-mocha"}}
kill -TERM {process IDs}
```
For the final 2 nodes, the shutdown process will take longer (about a minute each) and will eventually force the nodes to stop. This is because, with only 2 of 5 nodes left, a majority of replicas are not available, and so the cluster is no longer operational.
1. To restart the cluster at a later time, run the same `cockroach start` commands as in [Step 1. Start a 6-node cluster](#step-1-start-a-6-node-cluster) from the directory containing the nodes' data stores.
2. If you do not plan to restart the cluster, you may want to remove the nodes' data stores and the HAProxy config files:
```shell theme={"theme":{"light":"catppuccin-mocha","dark":"catppuccin-mocha"}}
$ rm -rf fault-node1 fault-node2 fault-node3 fault-node4 fault-node5 fault-node6 haproxy.cfg haproxy.cfg.saved
```
## What's next?
Explore other CockroachDB benefits and features:
* Replication & Rebalancing
* CockroachDB Resilience
* Serializable Transactions