> ## Documentation Index
> Fetch the complete documentation index at: https://cockroachlabs.mintlify.site/llms.txt
> Use this file to discover all available pages before exploring further.
# Transactions Page
export const InternalLink = ({version, path = "", children, ...props}) => {
let detectedVersion = version || "stable";
if (typeof window !== 'undefined' && !version) {
const match = window.location.pathname.match(/\/docs\/([^/]+)/);
if (match) {
detectedVersion = match[1];
}
}
const normalizedPath = path.startsWith("/") ? path.slice(1) : path;
return
{children}
;
};
On a secure cluster, you must be an `admin` user or a SQL user with the `VIEWACTIVITY` or `VIEWACTIVITYREDACTED` system privilege (or the legacy `VIEWACTIVITY` role option) to access this area of the DB Console. Refer to DB Console security.
The **Transactions** page provides information about the execution of SQL transactions in your cluster, using data in the cluster's [`crdb_internal` system catalog](../v26.1/monitoring-and-alerting.html#crdb_internal-system-catalog).
To view this page, click **SQL Activity** in the left-hand navigation of the DB Console. Click the **Transactions** tab.
It offers two views:
* **Transaction Fingerprints** show information about completed SQL transactions.
* **Active Executions**, show information about SQL transactions which are currently executing.
Choose a view by selecting the **Transaction Fingerprints** or **Active Executions** radio button. The selection is retained when you switch between the **Statements** and **Transactions** tabs on the **SQL Activity** page.
In contrast to the **Statements** page, which displays [SQL statement fingerprints](statements-page.html#sql-statement-fingerprints), the **Transactions** page displays *transaction fingerprints*, which are SQL statement fingerprints grouped by transaction.
## Transaction Fingerprints view
The **Transaction Fingerprints** view helps you:
* Identify frequently [retried](../v26.1/transactions.html#transaction-retries) transactions.
* Troubleshoot high-latency transactions or execution failures.
* View transaction [details](#transaction-details-page).
To view this page, click **SQL Activity** in the left-hand navigation of the DB Console.
Click the **Transactions** tab. The **Transaction Fingerprints** radio button is selected and the [Transactions table](#transactions-table) displays.
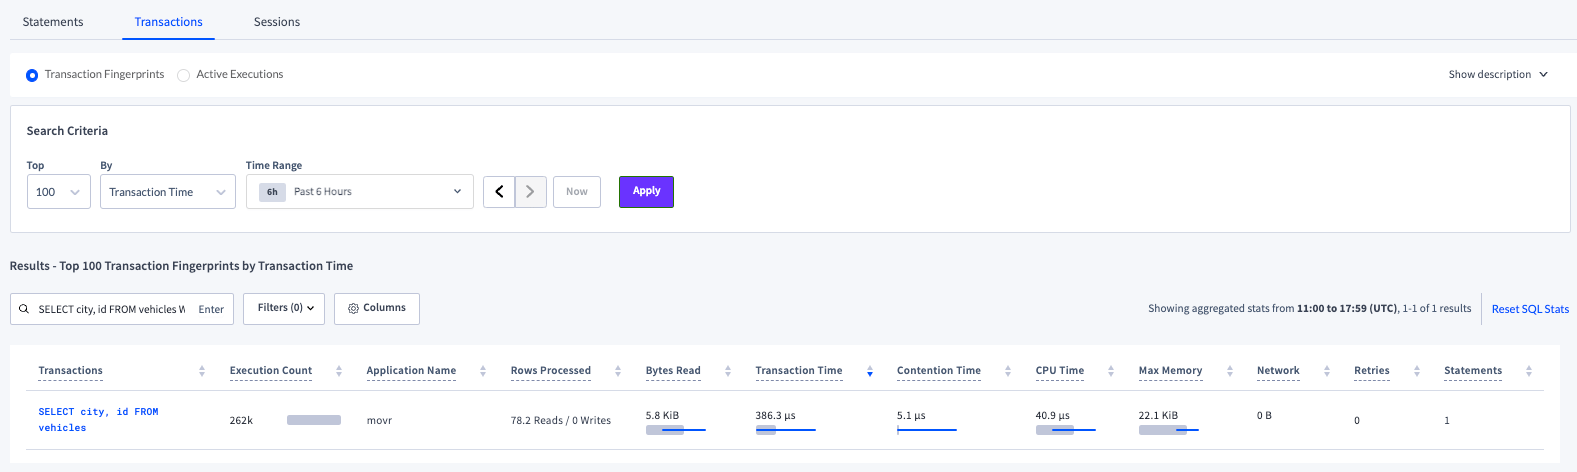
The following screenshot shows the transaction fingerprint for `SELECT city, id FROM vehicles WHERE city = $1` while running the [`movr` workload](../v26.1/cockroach-workload.html#run-the-movr-workload):
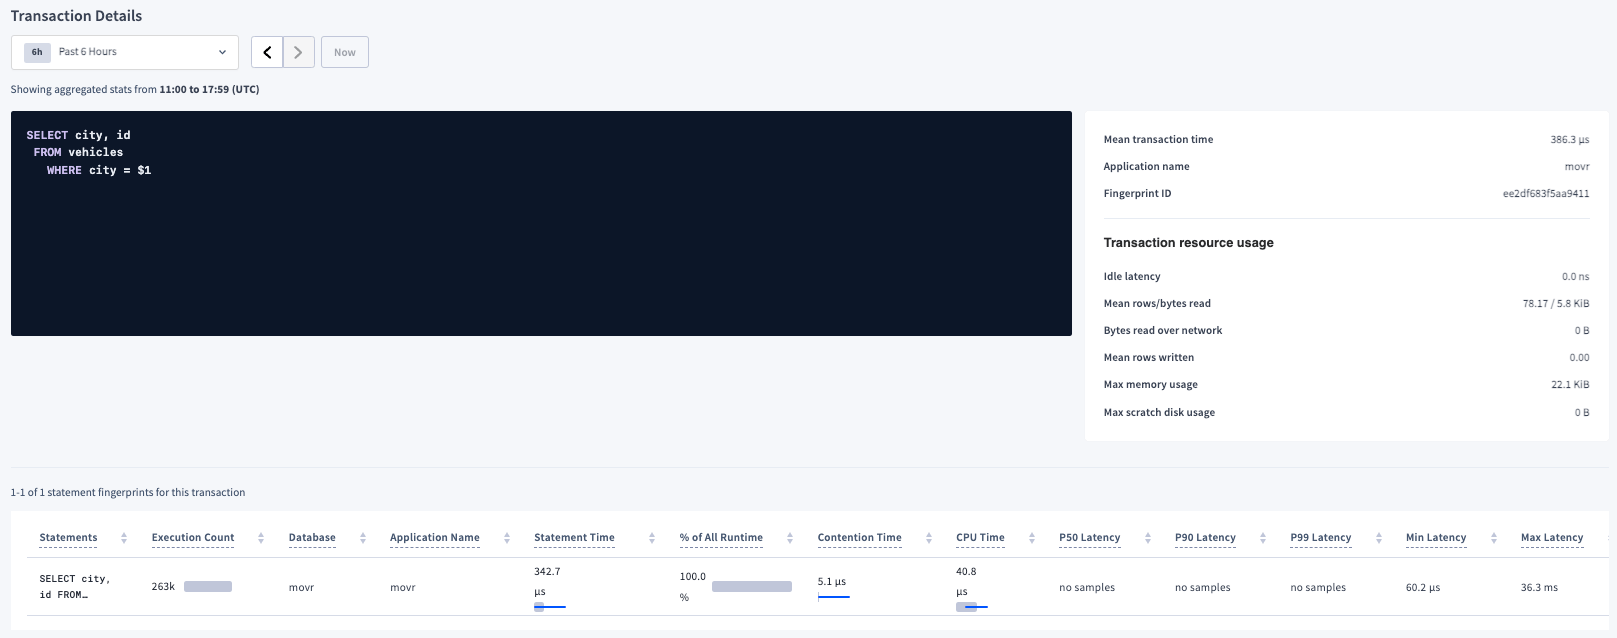
 If you click the transaction fingerprint in the **Transactions** column, the [**Transaction Details** page](#transaction-details-page) displays.
 ## Active Executions view
The **Active Executions** view helps you:
* Understand and tune workload performance, particularly for long-running transactions.
To display this view, click **SQL Activity** in the left-hand navigation of the DB Console.
The **Statements** tab is selected. Click the **Transactions** tab and the **Active Executions** radio button. The [Active Executions table](#active-executions-table) displays.
When Auto [Refresh](#refresh) is On, active executions are polled every 10 seconds. Faster-running executions will potentially disappear upon each refresh.
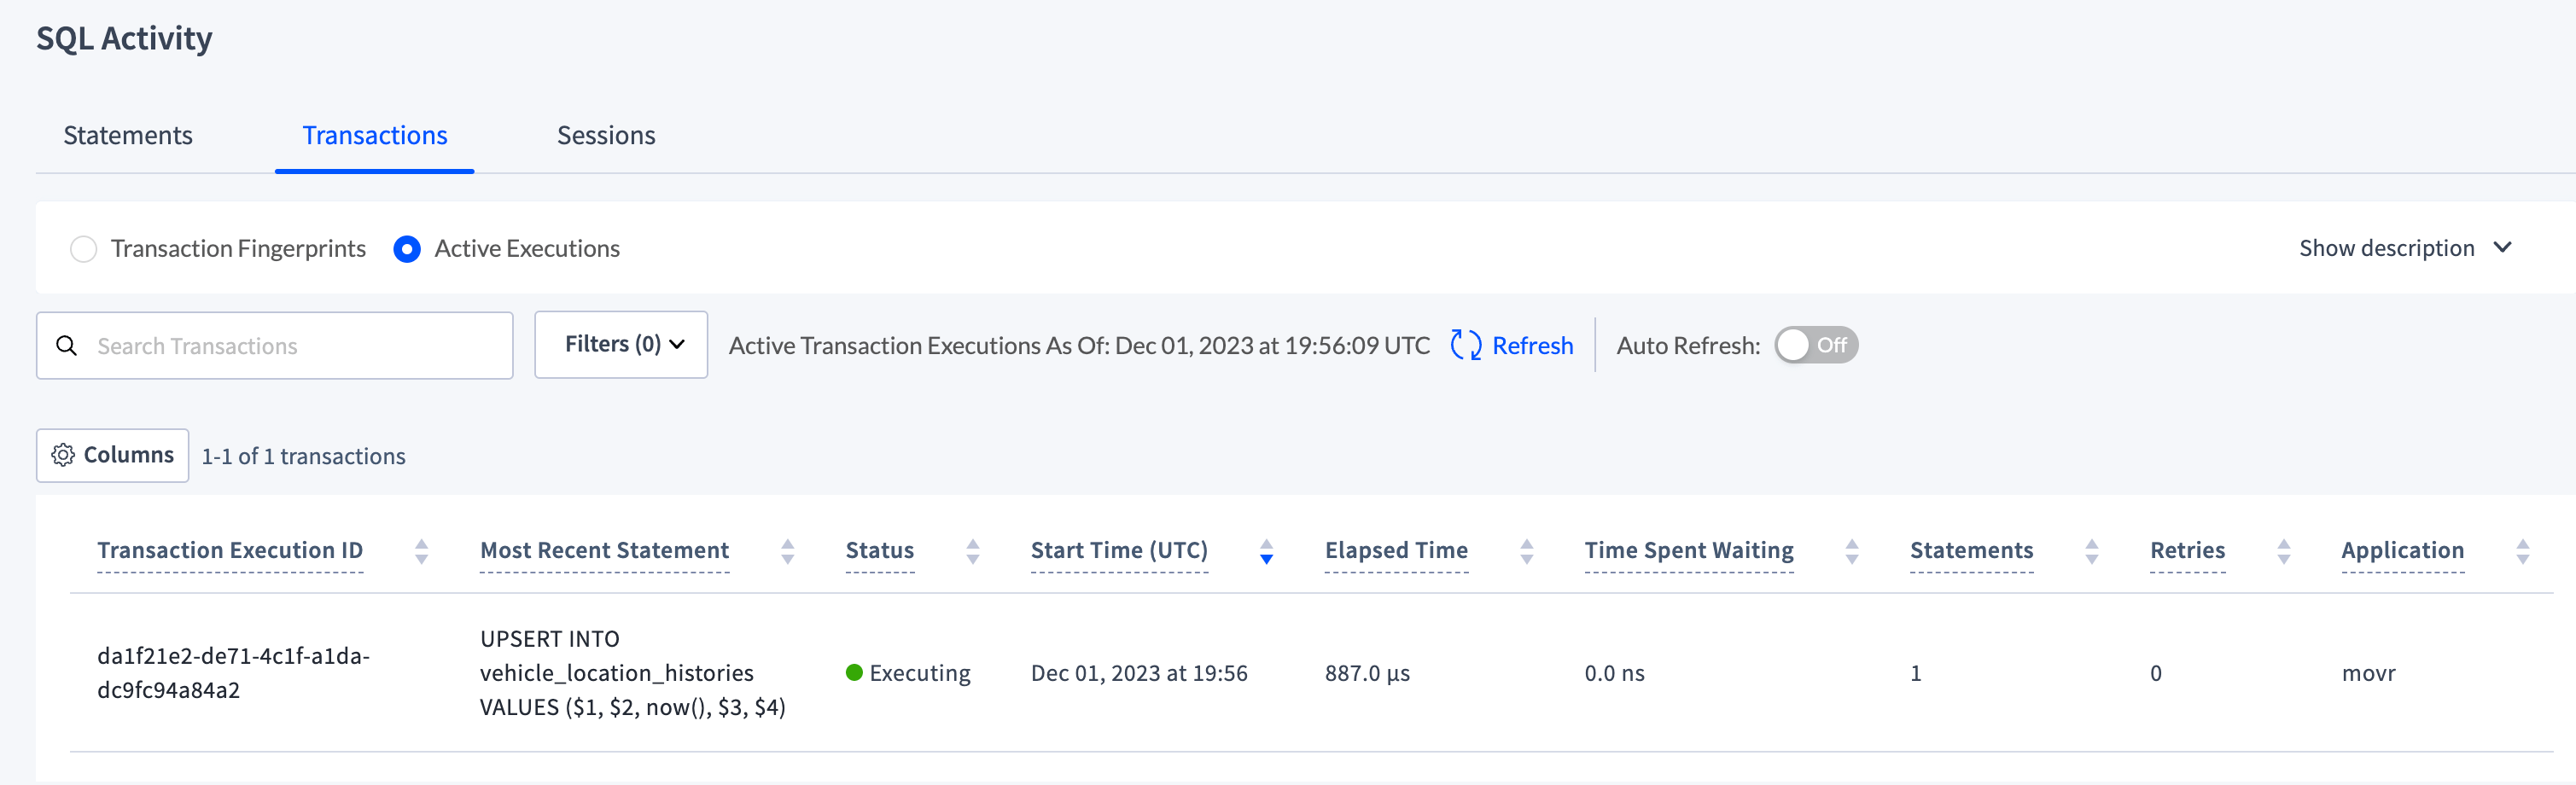
The following screenshot shows the active statement execution for `UPSERT INTO vehicle_location_histories VALUES ($1, $2, now(), $4, $5)` while running the [`movr` workload](../v26.1/cockroach-workload.html#run-the-movr-workload):
## Active Executions view
The **Active Executions** view helps you:
* Understand and tune workload performance, particularly for long-running transactions.
To display this view, click **SQL Activity** in the left-hand navigation of the DB Console.
The **Statements** tab is selected. Click the **Transactions** tab and the **Active Executions** radio button. The [Active Executions table](#active-executions-table) displays.
When Auto [Refresh](#refresh) is On, active executions are polled every 10 seconds. Faster-running executions will potentially disappear upon each refresh.
The following screenshot shows the active statement execution for `UPSERT INTO vehicle_location_histories VALUES ($1, $2, now(), $4, $5)` while running the [`movr` workload](../v26.1/cockroach-workload.html#run-the-movr-workload):
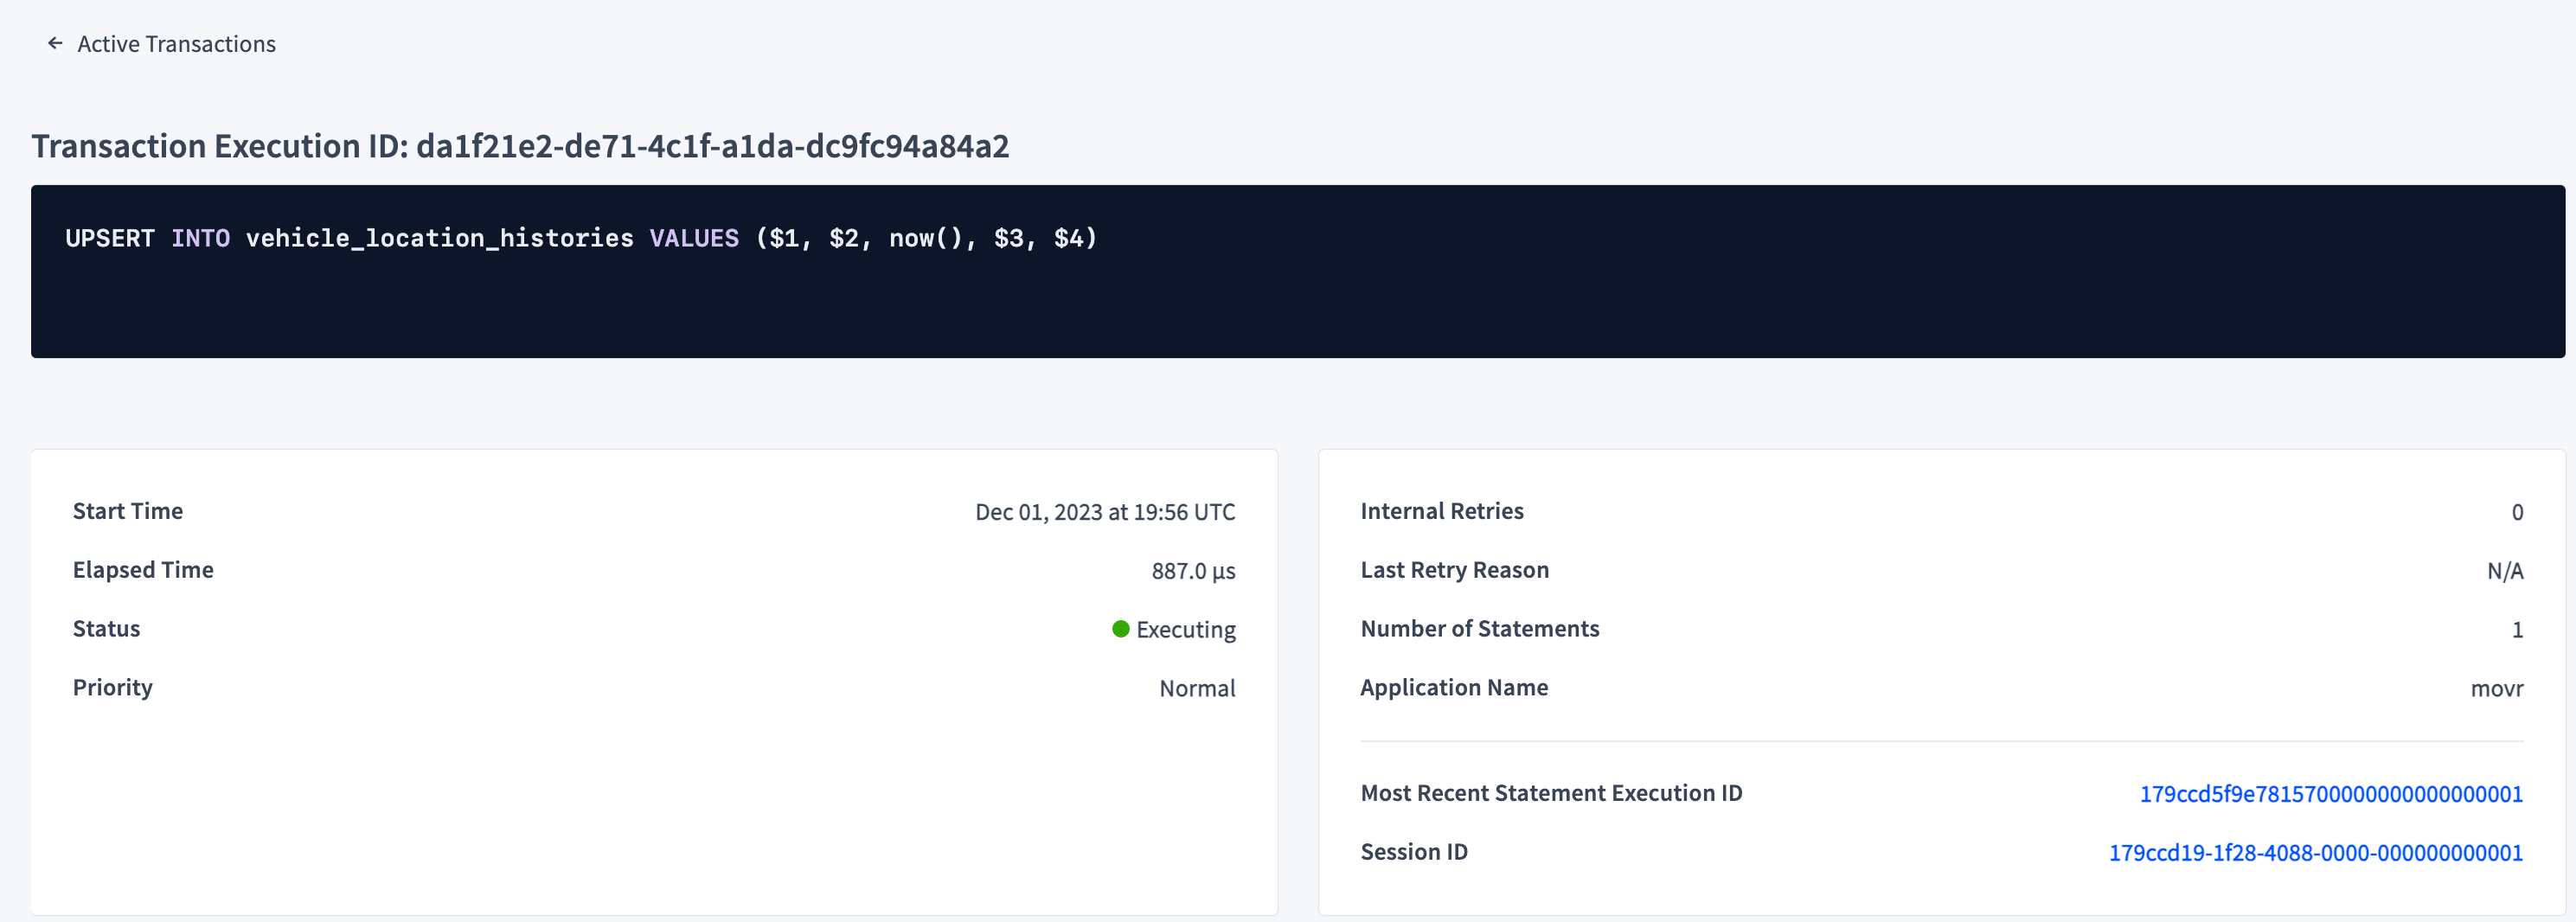
 If you click the execution ID in the **Transaction Execution ID** column, the [**Transaction Execution** details page](#transaction-execution-details-page) displays.
 ### Refresh
To control refresh of the data on the Active Executions views of the SQL Activity Statements and Transactions pages, the following controls have been added:
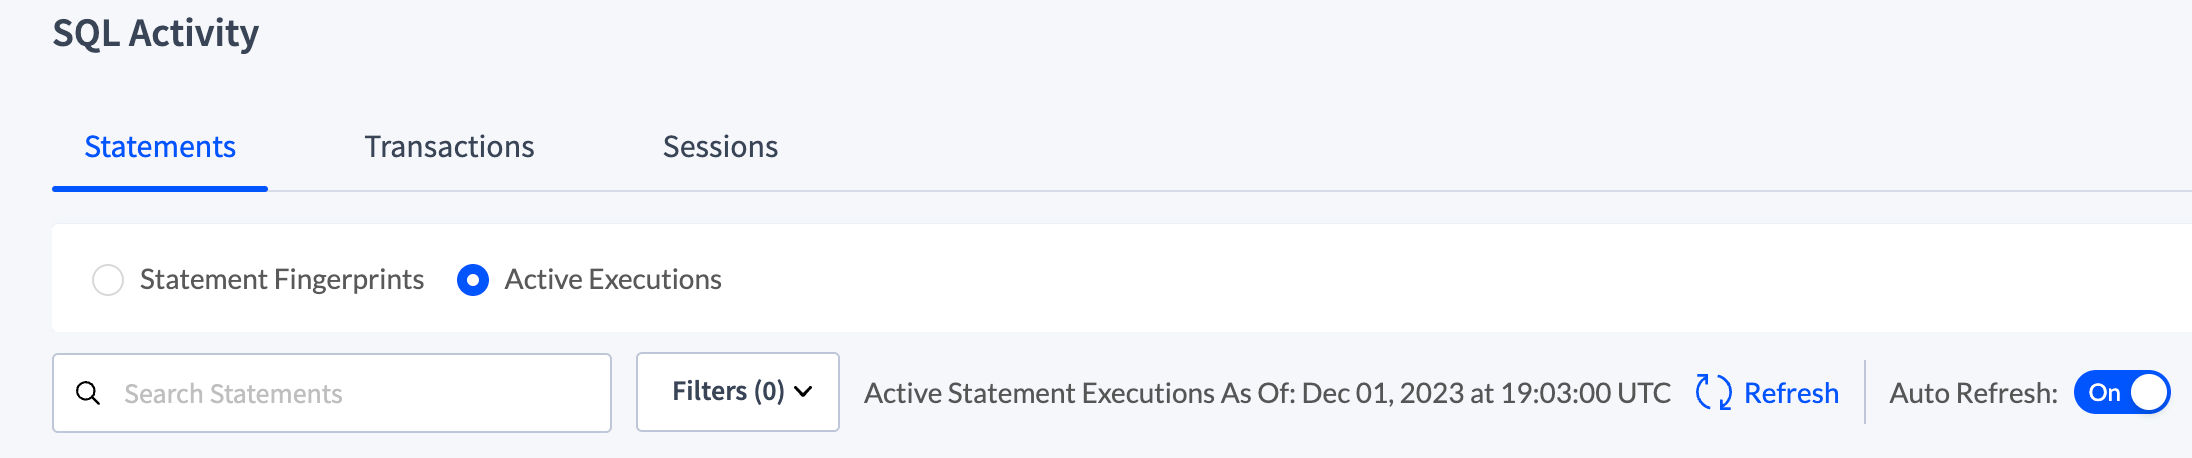
* An **Active Statements|Transactions As Of** timestamp: Indicates when the last refresh was performed.
* A manual **Refresh** button: When clicked, refreshes data immediately.
* An **Auto Refresh** toggle: When toggled **On** (default), refreshes data immediately and then automatically every 10 seconds. When toggled **Off**, stops automatic data refresh. The toggle setting is shared by both the Statements and the Transactions pages. Changing the setting on one page changes it on the other page.
### Refresh
To control refresh of the data on the Active Executions views of the SQL Activity Statements and Transactions pages, the following controls have been added:
* An **Active Statements|Transactions As Of** timestamp: Indicates when the last refresh was performed.
* A manual **Refresh** button: When clicked, refreshes data immediately.
* An **Auto Refresh** toggle: When toggled **On** (default), refreshes data immediately and then automatically every 10 seconds. When toggled **Off**, stops automatic data refresh. The toggle setting is shared by both the Statements and the Transactions pages. Changing the setting on one page changes it on the other page.
 If **Auto Refresh** is toggled **On**, navigating to the Active Executions view on either the Statements page or Transactions page refreshes the data.
If **Auto Refresh** is toggled **Off** and the data has not been refreshed in over 10 minutes, there will be an alert under the controls similar to: `Your active statements|transactions data is 11 minutes old. Consider refreshing for the latest information.`
### Refresh
To control refresh of the data on the Active Executions views of the SQL Activity Statements and Transactions pages, the following controls have been added:
* An **Active Statements|Transactions As Of** timestamp: Indicates when the last refresh was performed.
* A manual **Refresh** button: When clicked, refreshes data immediately.
* An **Auto Refresh** toggle: When toggled **On** (default), refreshes data immediately and then automatically every 10 seconds. When toggled **Off**, stops automatic data refresh. The toggle setting is shared by both the Statements and the Transactions pages. Changing the setting on one page changes it on the other page.
If **Auto Refresh** is toggled **On**, navigating to the Active Executions view on either the Statements page or Transactions page refreshes the data.
If **Auto Refresh** is toggled **Off** and the data has not been refreshed in over 10 minutes, there will be an alert under the controls similar to: `Your active statements|transactions data is 11 minutes old. Consider refreshing for the latest information.`
## Transaction Fingerprints results
The transaction fingerprints returned are determined by the selected **Search Criteria**:
### Search Criteria
By default, the **Top** `100` transaction fingerprints **By** `Transaction Time` for the `Past Hour` are returned.
1. To change the number of results returned, select `25`, `50`, `100`, or `500` from the **Top** dropdown. To return a larger number, select `More` and choose an option: `1000`, `5000`, `10000`.
2. To change the sort column, from the **By** dropdown, select a commonly sorted column: `CPU Time`, `Contention Time`, `Execution Count`, or `Transaction Time`. To sort by other columns, select `More` from the dropdown and choose an option: `Max Memory`, `Network`, `Retries`, `Rows Processed`.
The `More` options may increase the page loading time and are not generally recommended.
1. Select the [**Time Range**](#time-interval).
2. Click **Apply**.
The list of transactions that satisfy the search criteria is displayed. The results can be further [searched and filtered](#search-and-filter).
Results are not automatically refreshed.
The actual time range of the statistics is displayed at the top right of the results, for example, `Showing aggregated stats from 20:00 to 21:59 (UTC)`. If you select a preset time interval, such as `Past Hour`, be aware that since the statistics displayed are not automatically refreshed, they may become stale. To see the latest statistics, update the **Search Criteria** and apply.
However, it may take up to 10 minutes for the most recent statistics to be included in the aggregated statistics. 10 minutes is the default for the [`sql.stats.flush.interval` cluster setting](#transaction-statistics). For in-memory statistics, directly query the following in-memory table: `crdb_internal.cluster_transaction_statistics`. Alternatively, use the [**Active Executions** view](#active-executions-view).
### Time interval
To view transaction fingerprints within a specific time interval, select a time interval from the selector at the top of the tab. The time interval field supports preset time intervals (1 Hour, 6 Hours, 1 Day, etc.) and custom time intervals. To select a custom time interval, click the time interval field and select **Custom time interval**. In the **Start (UTC)** and **End (UTC)** fields select or type a date and time.
Use the arrow buttons to cycle through previous and next time intervals. To select the most recent interval, click **Now**. When you select a time interval, the same interval is selected in the [Metrics](ui-overview.html#metrics) page.
CockroachDB persists transaction statistics up to 1 million rows before the oldest row is deleted. The retention period of statistics is reduced the more active a workload is and the more distinct statement fingerprints there are.
It's possible to select an interval for which no transaction statistics exist.
## Search and filter
By default, the **Transactions** page shows transactions from all applications and databases running on the cluster.
For the **Transaction Fingerprints** view, the search and filter are applied **after** results are returned based on the [**Search Criteria**](#search-criteria).
### Search field
To search using the search field:
1. Enter a string in the search box at the top of the tab. To search for exact terms in order, wrap the search string in quotes.
2. Press `Enter`.
The list of transactions is filtered by the string.
### Filter
To filter the transactions:
1. Click the **Filters** field.
* To filter by [application](connection-parameters.html#additional-connection-parameters), select **App** and select one or more applications.
* Queries from the SQL shell are displayed under the `$ cockroach` app.
* If you haven't set `application_name` in a client connection string, it appears as `unset`.
* To filter by the nodes on which the transaction ran, click the **Node** field and select one or more checkboxes.
* To display only statement fingerprints that take longer than a specified time to run, specify the time and units.
2. Click **Apply**.
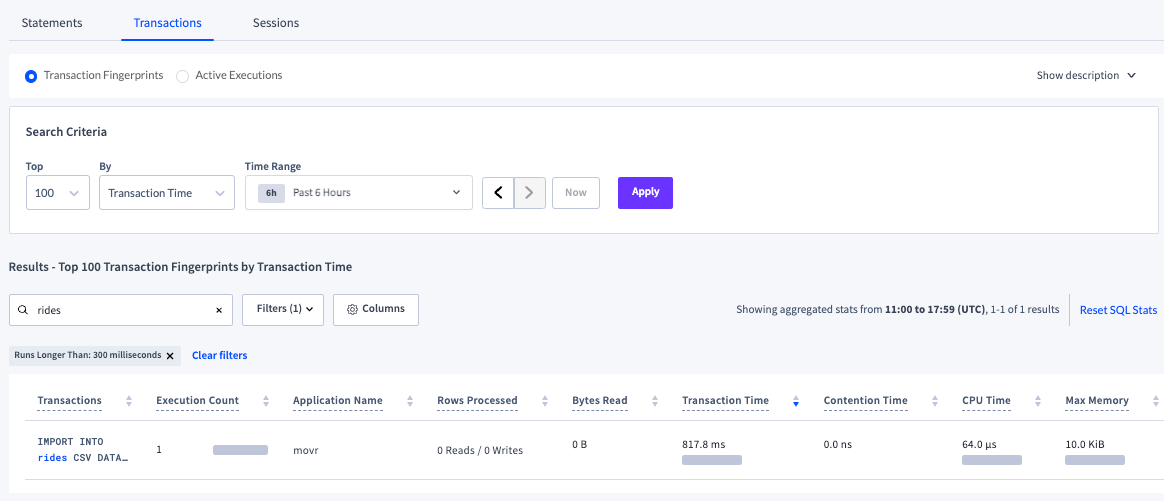
The following screenshot shows the transactions that contain the string `rides` for the `movr` application filtered by `Runs Longer Than: 300 milliseconds`:
If **Auto Refresh** is toggled **On**, navigating to the Active Executions view on either the Statements page or Transactions page refreshes the data.
If **Auto Refresh** is toggled **Off** and the data has not been refreshed in over 10 minutes, there will be an alert under the controls similar to: `Your active statements|transactions data is 11 minutes old. Consider refreshing for the latest information.`
### Refresh
To control refresh of the data on the Active Executions views of the SQL Activity Statements and Transactions pages, the following controls have been added:
* An **Active Statements|Transactions As Of** timestamp: Indicates when the last refresh was performed.
* A manual **Refresh** button: When clicked, refreshes data immediately.
* An **Auto Refresh** toggle: When toggled **On** (default), refreshes data immediately and then automatically every 10 seconds. When toggled **Off**, stops automatic data refresh. The toggle setting is shared by both the Statements and the Transactions pages. Changing the setting on one page changes it on the other page.
If **Auto Refresh** is toggled **On**, navigating to the Active Executions view on either the Statements page or Transactions page refreshes the data.
If **Auto Refresh** is toggled **Off** and the data has not been refreshed in over 10 minutes, there will be an alert under the controls similar to: `Your active statements|transactions data is 11 minutes old. Consider refreshing for the latest information.`
## Transaction Fingerprints results
The transaction fingerprints returned are determined by the selected **Search Criteria**:
### Search Criteria
By default, the **Top** `100` transaction fingerprints **By** `Transaction Time` for the `Past Hour` are returned.
1. To change the number of results returned, select `25`, `50`, `100`, or `500` from the **Top** dropdown. To return a larger number, select `More` and choose an option: `1000`, `5000`, `10000`.
2. To change the sort column, from the **By** dropdown, select a commonly sorted column: `CPU Time`, `Contention Time`, `Execution Count`, or `Transaction Time`. To sort by other columns, select `More` from the dropdown and choose an option: `Max Memory`, `Network`, `Retries`, `Rows Processed`.
The `More` options may increase the page loading time and are not generally recommended.
1. Select the [**Time Range**](#time-interval).
2. Click **Apply**.
The list of transactions that satisfy the search criteria is displayed. The results can be further [searched and filtered](#search-and-filter).
Results are not automatically refreshed.
The actual time range of the statistics is displayed at the top right of the results, for example, `Showing aggregated stats from 20:00 to 21:59 (UTC)`. If you select a preset time interval, such as `Past Hour`, be aware that since the statistics displayed are not automatically refreshed, they may become stale. To see the latest statistics, update the **Search Criteria** and apply.
However, it may take up to 10 minutes for the most recent statistics to be included in the aggregated statistics. 10 minutes is the default for the [`sql.stats.flush.interval` cluster setting](#transaction-statistics). For in-memory statistics, directly query the following in-memory table: `crdb_internal.cluster_transaction_statistics`. Alternatively, use the [**Active Executions** view](#active-executions-view).
### Time interval
To view transaction fingerprints within a specific time interval, select a time interval from the selector at the top of the tab. The time interval field supports preset time intervals (1 Hour, 6 Hours, 1 Day, etc.) and custom time intervals. To select a custom time interval, click the time interval field and select **Custom time interval**. In the **Start (UTC)** and **End (UTC)** fields select or type a date and time.
Use the arrow buttons to cycle through previous and next time intervals. To select the most recent interval, click **Now**. When you select a time interval, the same interval is selected in the [Metrics](ui-overview.html#metrics) page.
CockroachDB persists transaction statistics up to 1 million rows before the oldest row is deleted. The retention period of statistics is reduced the more active a workload is and the more distinct statement fingerprints there are.
It's possible to select an interval for which no transaction statistics exist.
## Search and filter
By default, the **Transactions** page shows transactions from all applications and databases running on the cluster.
For the **Transaction Fingerprints** view, the search and filter are applied **after** results are returned based on the [**Search Criteria**](#search-criteria).
### Search field
To search using the search field:
1. Enter a string in the search box at the top of the tab. To search for exact terms in order, wrap the search string in quotes.
2. Press `Enter`.
The list of transactions is filtered by the string.
### Filter
To filter the transactions:
1. Click the **Filters** field.
* To filter by [application](connection-parameters.html#additional-connection-parameters), select **App** and select one or more applications.
* Queries from the SQL shell are displayed under the `$ cockroach` app.
* If you haven't set `application_name` in a client connection string, it appears as `unset`.
* To filter by the nodes on which the transaction ran, click the **Node** field and select one or more checkboxes.
* To display only statement fingerprints that take longer than a specified time to run, specify the time and units.
2. Click **Apply**.
The following screenshot shows the transactions that contain the string `rides` for the `movr` application filtered by `Runs Longer Than: 300 milliseconds`:
 ## Transaction statistics
Statistics aggregation is controlled by the `sql.stats.aggregation.interval` cluster setting, set to 1 hour by default.
Aggregated statistics are flushed from memory to statistics tables in the `crdb_internal` system catalog every 10 minutes. The flushing interval is controlled by the `sql.stats.flush.interval` cluster setting.
The default retention period of the statistics tables is based on the number of rows up to 1 million records. When this threshold is reached, the oldest records are deleted. The `diagnostics.forced_sql_stat_reset.interval` cluster setting controls when persisted statistics are deleted only if the internal cleanup service experiences a failure.
If desired, [admin users](security-reference/authorization.html#admin-role) may reset SQL statistics in the DB Console UI and `crdb_internal` system catalog by clicking **reset SQL stats**. This link does not appear for non-admin users.
For an example of querying the statistics table, see [Example](statements-page.html#example).
If you haven't yet executed any transactions in the cluster as a user, this page will be blank.
## Transactions table
Click **Columns** to select the columns to display in the table.
The Transactions table gives details for each transaction fingerprint in the transaction:
| Column | Description |
| -------------------------- | ----------------------------------------------------------------------------------------------------------------------------------------------------------------------------------------------------------------------------------------------------------------------------------------------------------------------------------------------------------------------------------------------------------------------------------------------------------- |
| Transactions | The [SQL statement fingerprints](statements-page.html#sql-statement-fingerprints) that make up the transaction. To view the transaction fingerprint and details, click to open the [Transaction Details page](#transaction-details-page).
## Transaction statistics
Statistics aggregation is controlled by the `sql.stats.aggregation.interval` cluster setting, set to 1 hour by default.
Aggregated statistics are flushed from memory to statistics tables in the `crdb_internal` system catalog every 10 minutes. The flushing interval is controlled by the `sql.stats.flush.interval` cluster setting.
The default retention period of the statistics tables is based on the number of rows up to 1 million records. When this threshold is reached, the oldest records are deleted. The `diagnostics.forced_sql_stat_reset.interval` cluster setting controls when persisted statistics are deleted only if the internal cleanup service experiences a failure.
If desired, [admin users](security-reference/authorization.html#admin-role) may reset SQL statistics in the DB Console UI and `crdb_internal` system catalog by clicking **reset SQL stats**. This link does not appear for non-admin users.
For an example of querying the statistics table, see [Example](statements-page.html#example).
If you haven't yet executed any transactions in the cluster as a user, this page will be blank.
## Transactions table
Click **Columns** to select the columns to display in the table.
The Transactions table gives details for each transaction fingerprint in the transaction:
| Column | Description |
| -------------------------- | ----------------------------------------------------------------------------------------------------------------------------------------------------------------------------------------------------------------------------------------------------------------------------------------------------------------------------------------------------------------------------------------------------------------------------------------------------------- |
| Transactions | The [SQL statement fingerprints](statements-page.html#sql-statement-fingerprints) that make up the transaction. To view the transaction fingerprint and details, click to open the [Transaction Details page](#transaction-details-page).
Transaction fingerprints are displayed per application rather than grouped into a single fingerprint. This may result in multiple rows for the same transaction fingerprint, one per application name. |
| Execution Count | Cumulative number of executions of this transaction within the [time interval](#time-interval).
The bar indicates the ratio of runtime success (gray) to [retries](transactions.html#transaction-retries) (red) for the transaction. |
| Application Name | The name specified by the [`application_name` session setting](show-vars.html#supported-variables). |
| Rows Processed | Average number of rows read and written while executing statements with this fingerprint within the time interval. |
| Bytes Read | Aggregation of all bytes [read from disk](architecture/life-of-a-distributed-transaction.html#reads-from-the-storage-layer) across all operators for this transaction within the time interval.
The gray bar indicates the mean number of bytes read from disk. The blue bar indicates one standard deviation from the mean. |
| Transaction Time | Average [planning and execution time](architecture/sql-layer.html#sql-parser-planner-executor) of this transaction within the time interval.
The gray bar indicates the mean latency. The blue bar indicates one standard deviation from the mean. |
| Contention Time | Average time this transaction was [in contention](performance-best-practices-overview.html#understanding-and-avoiding-transaction-contention) with other transactions within the time interval.
The gray bar indicates mean contention time. The blue bar indicates one standard deviation from the mean. Hover over the bar to display exact values. |
| CPU Time | Average CPU time spent executing within the specified time interval.
The gray bar indicates mean CPU time. The blue bar indicates one standard deviation from the mean.
The CPU time includes time spent in the SQL layer. It does not include time spent in the storage layer. |
| Max Memory | Maximum memory used by this transaction at any time during its execution within the time interval.
The gray bar indicates the average max memory usage. The blue bar indicates one standard deviation from the mean. |
| Network | Amount of data transferred over the network for this transaction within the time interval.
If this value is 0, the transaction was executed on a single node.
The gray bar indicates the mean number of bytes sent over the network. The blue bar indicates one standard deviation from the mean. |
| Retries | Cumulative number of [retries](transactions.html#transaction-retries) of this transaction within the time interval. |
| Regions/Nodes | The region and nodes in which the transaction was executed.
Nodes are not visible for CockroachDB Basic clusters. |
| Statements | Number of SQL statements in the transaction. |
| Transaction Fingerprint ID | The ID of the transaction fingerprint. |
Significant transactions on your database are likely to have a high execution count or number of rows read.
To view details of a transaction, click a transaction fingerprint in the **Transactions** column to open the **Transaction Details** page.
## Transaction Details page
The details displayed on the **Transaction Details** page reflect the [time interval](#time-interval) selected on the **Transactions** page and the application name and database specified in the selected row of the [Transactions table](#transactions-table).
* The *transaction fingerprint* is displayed as a list of the individual [SQL statement fingerprints](statements-page.html#sql-statement-fingerprints) in the transaction.
* The **Mean transaction time**: The mean average time it took to execute the transaction within the aggregation interval.
* The **Application name**: The name specified by the [`application_name`](show-vars.html#supported-variables) session setting.
* **Transaction resource usage** shows overall statistics about the transaction.
* **Idle latency**: The time the transaction spent waiting on the client while the transaction remained open.
* **Commit latency**: The time required to finish committing the transaction after the commit phase began.
* **Mean rows/bytes read**: The mean average number of rows and bytes [read from the storage layer](architecture/life-of-a-distributed-transaction.html#reads-from-the-storage-layer) during the execution of the transaction within the specified aggregation interval.
* **Bytes read over network**: The amount of data transferred over the network for this transaction within the aggregation interval.
If this value is 0, the statement was executed on a single node.
* **Mean rows written**: The mean number of rows written by this transaction.
* **Max memory usage**: The maximum memory used by this transaction at any time during its execution within the aggregation interval.
* **Max scratch disk usage**: The maximum amount of data [spilled to temporary storage on disk](vectorized-execution.html#disk-spilling-operations) while executing this transaction within the aggregation interval.
The **Insights** table is displayed when CockroachDB has detected a problem with the transaction fingerprint.
* **Insights**: Provides the [Workload Insight type](ui-insights-page.html#workload-insight-types).
* **Details**: Provides a description and possible recommendation.
* **Latest Execution ID**: The ID of the latest transaction execution. To display the [details of the transaction execution](ui-insights-page.html#transaction-execution-details), click the ID.
The **Statements Fingerprints** table displays the statement fingerprints of all the statements in the transaction. To display the [details of a statement fingerprint](statements-page.html#statement-fingerprint-page), click a statement fingerprint.
## Active Executions table
Click **Columns** to select the columns to display in the table.
The Active Executions table gives details for each transaction fingerprint in the transaction:
| Column | Description |
| ------------------------ | ----------------------------------------------------------------------------------------------------------------------------------------------------------- |
| Transaction Execution ID | The execution ID of the transaction. |
| Most Recent Statement | The most recently executed statement in the transaction. |
| Status | The status of the execution: `Preparing`, `Waiting`, or `Executing`. |
| Start Time (UTC) | The timestamp when the execution started. |
| Elapsed Time | The time elapsed since the transaction started. |
| Time Spent Waiting | The amount of time the execution experienced [lock contention](performance-best-practices-overview.html#understanding-and-avoiding-transaction-contention). |
| Statements | The number of statements in the transaction. |
| Retries | The number of times statements in the transaction were retried. |
| Application | The name specified by the [`application_name`](show-vars.html#supported-variables) session setting. |
To view details of an active transaction execution, click an execution ID in the **Transaction Execution ID** column to open the [**Transaction Execution** details page](#transaction-execution-details-page).
## Transaction execution details page
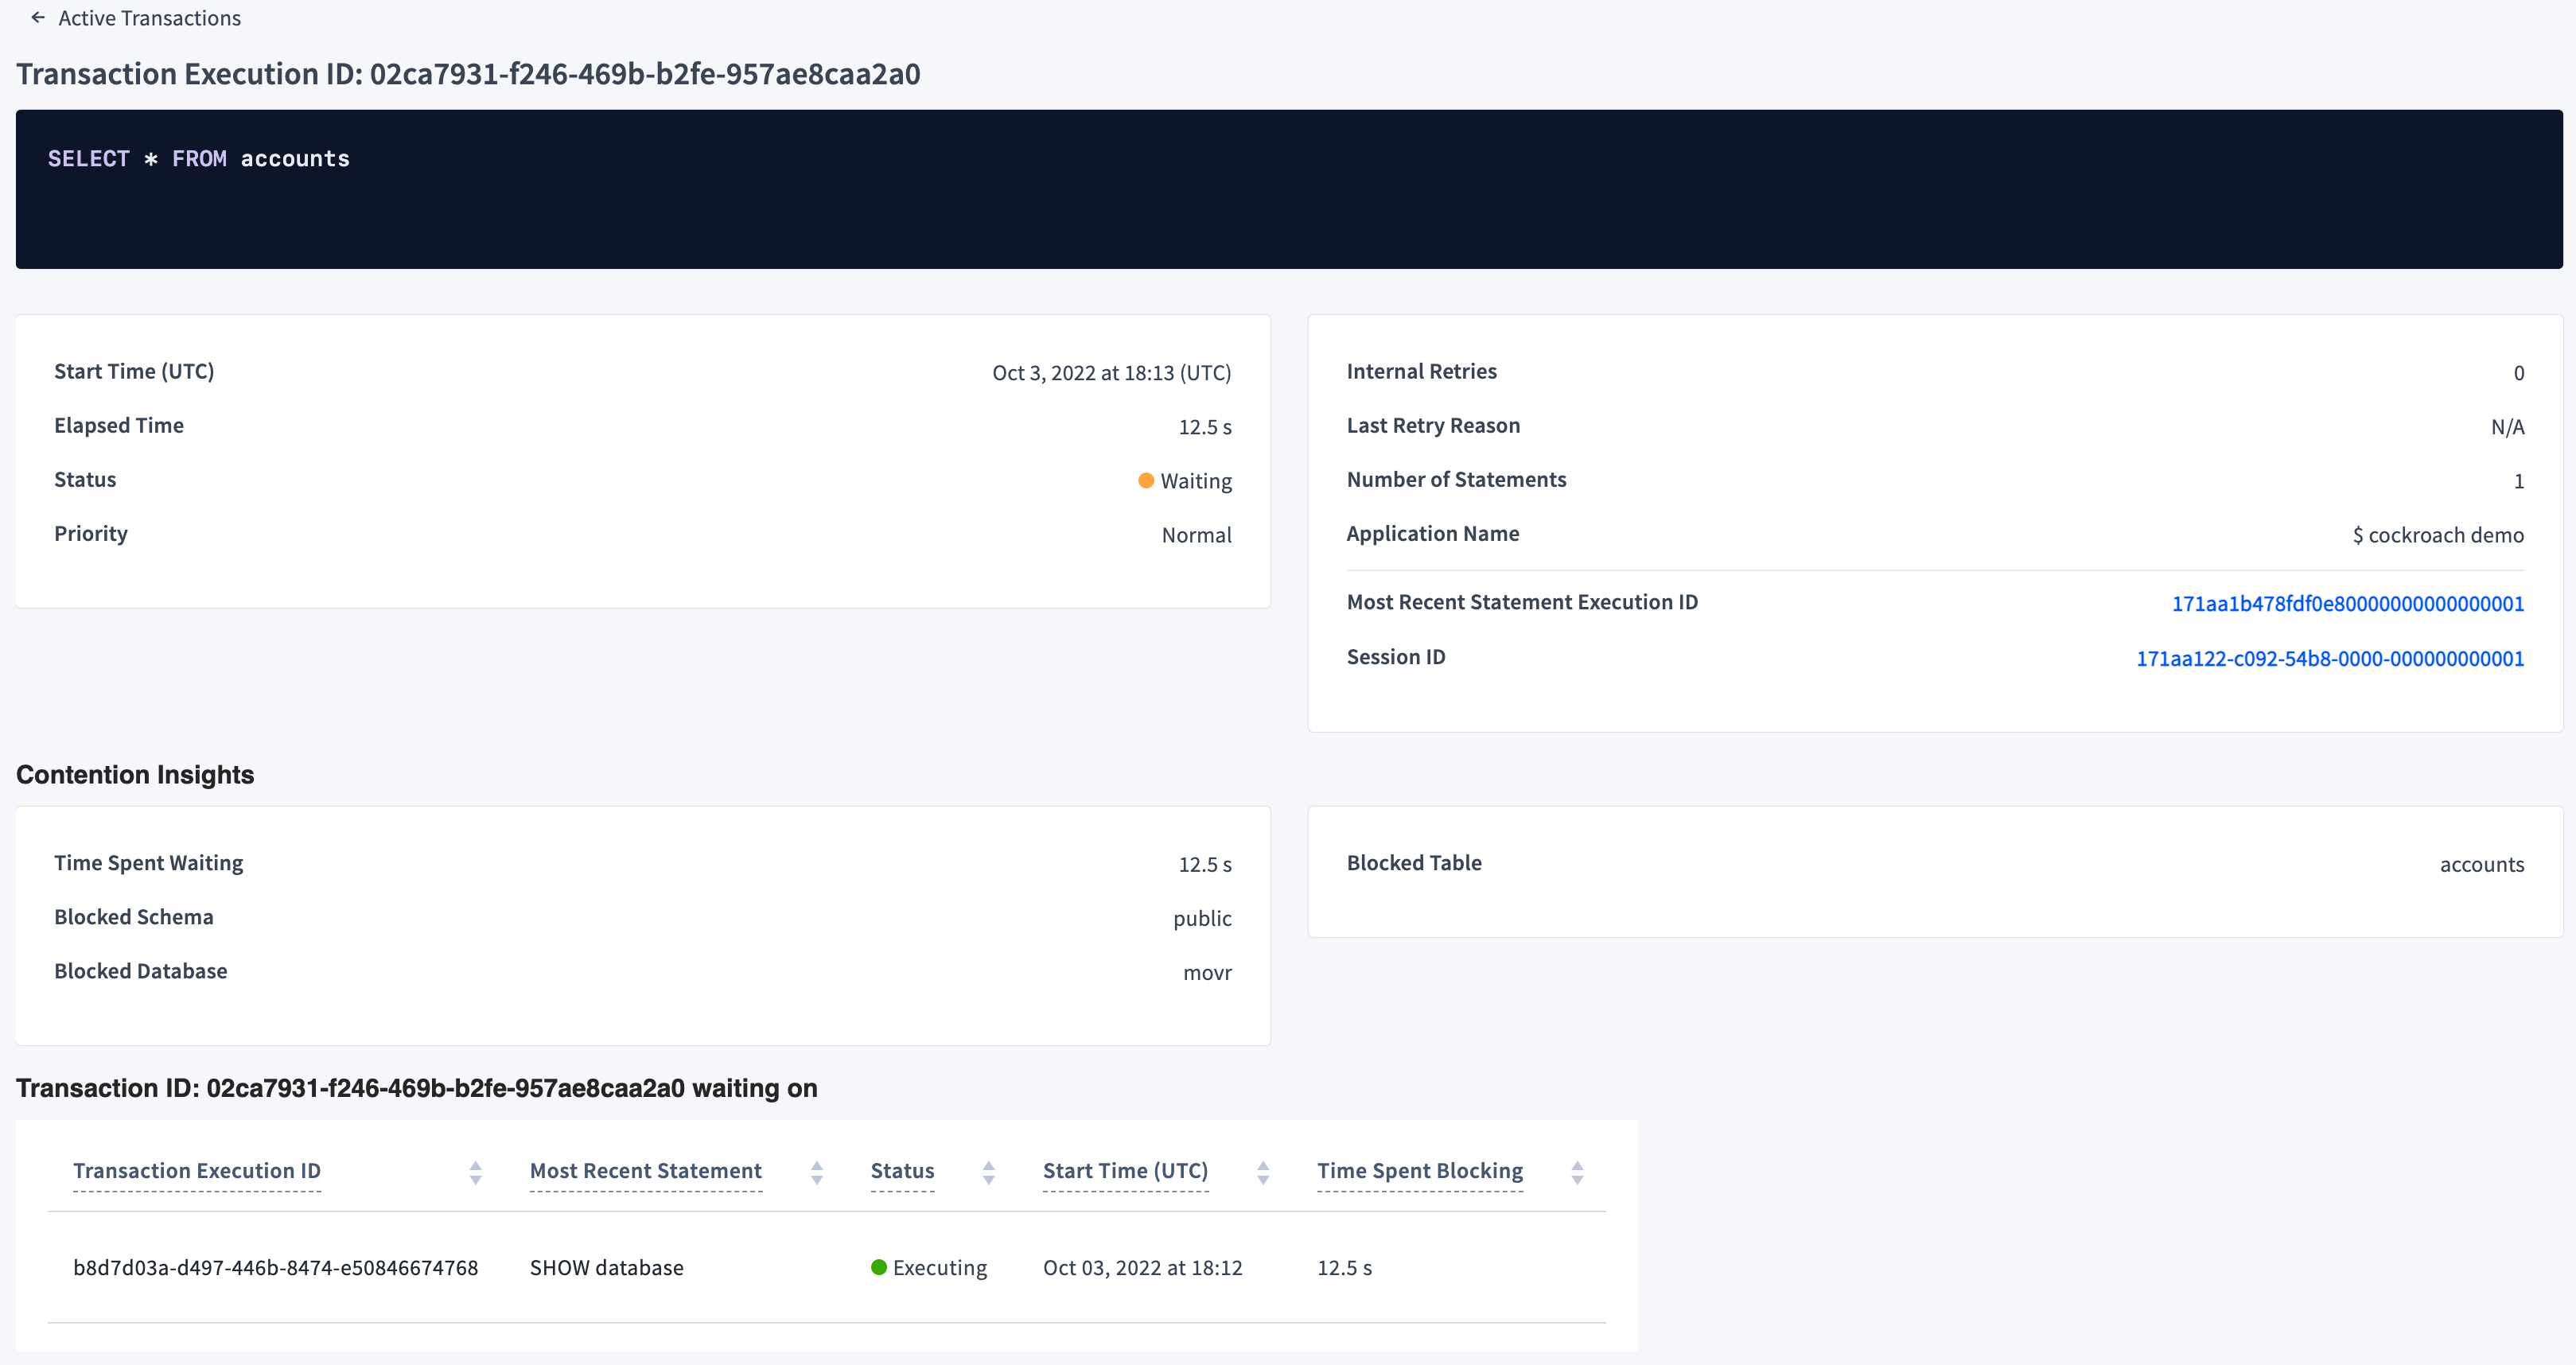
The transaction execution details page provides the following details on the transaction execution.
* **Start Time (UTC)**: The timestamp when the execution started.
* **Elapsed Time**: The time elapsed since the transaction started.
* **Status**: The status of the execution: `Preparing`, `Waiting`, or `Executing`.
* **Priority**: The [priority](transactions.html#transaction-priorities) of the transaction.
* **Internal Retries**: The number of retries of statements in the transaction.
* **Last Retry Reason**: The reason for the last statement retry.
* **Number of Statements**: The number of statements in the transaction.
* **Application Name**: The name specified by the [`application_name`](show-vars.html#supported-variables) session setting.
* **Most Recent Statement Execution ID**: Link to the ID of the most recently [executed statement](statements-page.html#active-executions-table) in the transaction.
* **Session ID**: Link to the ID of the session in which the transaction is running.
If a transaction execution is waiting, the transaction execution details are followed by Contention Insights and details of the transaction execution on which the blocked transaction execution is waiting. For more information about contention, see [Transaction contention](performance-best-practices-overview.html#transaction-contention).
 ## See also
* Transactions
* Transaction Layer
* Run Multi-Statement Transactions
* Transaction latency graphs
* [Transaction retries](transactions.html#transaction-retries)
* Statements Page
## See also
* Transactions
* Transaction Layer
* Run Multi-Statement Transactions
* Transaction latency graphs
* [Transaction retries](transactions.html#transaction-retries)
* Statements Page