> ## Documentation Index
> Fetch the complete documentation index at: https://cockroachlabs.mintlify.site/llms.txt
> Use this file to discover all available pages before exploring further.
# Query Spatial Data
export const InternalLink = ({version, path = "", children, ...props}) => {
let detectedVersion = version || "stable";
if (typeof window !== 'undefined' && !version) {
const match = window.location.pathname.match(/\/docs\/([^/]+)/);
if (match) {
detectedVersion = match[1];
}
}
const normalizedPath = path.startsWith("/") ? path.slice(1) : path;
return
{children}
;
};
This page provides information about working with spatial data in CockroachDB.
## Supported data types
Supported spatial data types include:
* Geometric objects such as points, lines, and polygons in 2-dimensional space. These are projected onto the flat surface of a plane and are represented in SQL by the `GEOMETRY` data type.
* Geographic objects, which are also made up of points, lines, polygons, etc., in 2-dimensional space. They are projected onto the surface of a sphere and are represented in SQL by the `GEOGRAPHY` data type. (Technically, they are projected onto a spheroid: "a sphere with a bulge"). The spheroid projection means that:
* The X and Y coordinates of 2-dimensional points are longitude and latitude values.
* The paths between geographic objects are not straight lines; they are curves, and so the distances between objects are calculated using [great circle math](https://wikipedia.org/wiki/Great-circle_distance).
## Compatibility
Just as CockroachDB strives for PostgreSQL compatibility, our spatial data support is designed to be as compatible as possible with the functionality provided by the [PostGIS](https://postgis.net) extension. CockroachDB is compatible with PostGIS Version 3.0 and up.
CockroachDB does not implement the full list of PostGIS built-in functions and operators. Also, spatial indexing works differently (see the [Performance](#performance) section below). For a list of the spatial functions CockroachDB supports, see Geospatial functions.
If your application needs support for functions that are not yet implemented, please [contact Support](https://support.cockroachlabs.com).
For a list of other known limitations, see Known Limitations.
### ORM compatibility
The following ORM spatial libraries are fully compatible with CockroachDB's spatial features:
* [Hibernate Spatial](https://docs.jboss.org/hibernate/orm/current/userguide/html_single/Hibernate_User_Guide.html#spatial)
[Hibernate 5.4.30.Final](https://in.relation.to/2021/03/19/hibernate-orm-5430-final-release/) added the `CockroachDB202SpatialDialect` dialect to the `hibernate-spatial` module. The `CockroachDB202SpatialDialect` dialect supports spatial features available in CockroachDB v20.2 and later.
* [RGeo/RGeo::ActiveRecord](https://github.com/rgeo/rgeo-activerecord)
CockroachDB's Active Record adapter ([`activerecord-cockroachdb-adapter`](https://github.com/cockroachdb/activerecord-cockroachdb-adapter)) uses [RGeo](https://github.com/rgeo/rgeo) and [RGeo::ActiveRecord](https://github.com/rgeo/rgeo-activerecord) for spatial support with Active Record v6.0.0+ and v7.0.0+. For information about using CockroachDB spatial features with Active Record, see the [`activerecord-cockroachdb-adapter` README](https://github.com/cockroachdb/activerecord-cockroachdb-adapter#working-with-spatial-data).
* [GeoDjango](https://github.com/cockroachdb/django-cockroachdb#gis-support)
Starting with CockroachDB 20.2.x and [`django-cockroachdb`](https://github.com/cockroachdb/django-cockroachdb) 3.1.3, CockroachDB is compatible with [GeoDjango](https://docs.djangoproject.com/en/3.1/ref/contrib/gis/). For information about using CockroachDB spatial features with GeoDjango, see the [`django-cockroachdb` README](https://github.com/cockroachdb/django-cockroachdb#gis-support).
Most PostGIS-compatible client libraries are incompatible with CockroachDB's spatial features without an adapter.
## Troubleshooting
For general CockroachDB troubleshooting information, see Troubleshooting Overview.
If you need help troubleshooting an issue with our spatial support, please get in touch using our Support resources.
## Performance
In order to avoid full table scans, make sure to add indexes to any columns that are accessed as part of a predicate in the `WHERE` clause. For geospatial columns, the index will only be used if the column is accessed using an index-accelerated geospatial function from the list below (all of these functions work on `GEOMETRY` data types; a `*` means that a function also works on `GEOGRAPHY` data types):
* `ST_Covers` (\*)
* `ST_CoveredBy` (\*)
* `ST_Contains`
* `ST_ContainsProperly`
* `ST_Crosses`
* `ST_DWithin` (\*)
* `ST_DFullyWithin`
* `ST_Equals`
* `ST_Intersects` (\*)
* `ST_Overlaps`
* `ST_Touches`
* `ST_Within`
To use a version of a function from the list above that will explicitly *not* use the index, add an underscore (`_`) to the beginning of the function name, e.g., `_ST_Covers`.
You can check which queries are using which indexes using the `EXPLAIN` statement. For more information about general query tuning (including index usage), see Optimize Statement Performance.
The syntax for adding an index to a geometry column is `CREATE INDEX index_name ON table_name USING GIST (column_name)`.
For example, to add an index to the `geom` column of the sample `tornadoes` table:
```sql theme={"theme":{"light":"catppuccin-mocha","dark":"catppuccin-mocha"}}
CREATE INDEX tornado_geom_idx ON tornadoes USING GIST (geom);
```
This creates a (spatial) GIN index on the `geom` column.
Because CockroachDB is a scale-out, multi-node database, our spatial indexing strategy is based on a [space-filling curve](https://wikipedia.org/wiki/Space-filling_curve)/quad-tree design (also known as "divide the space"), rather than the [R-Tree](https://wikipedia.org/wiki/R-tree) data structure used by some other spatial databases (also known as "divide the objects"). Other databases that use a "divide the space" strategy include Microsoft SQL Server and MongoDB.
For more detailed information about how CockroachDB's spatial indexes work, see Spatial indexes.
If you encounter behavior that you think is due to a performance issue, please get in touch using our Support resources.
## Examples
### Load NYC data for the PostGIS tutorial
Follow the steps below to load the SQL for the NYC data used in the [Introduction to PostGIS](https://postgis.net/workshops/postgis-intro/) tutorial.
CockroachDB can work with the tutorial up to Chapter 22, with the following exceptions:
* Do not try to load Shapefiles via the GUI as shown in the tutorial. Instead, follow the steps below to load the SQL data directly into CockroachDB. (We have already converted the tutorial Shapefiles to SQL for you.)
* CockroachDB does not support GML or KML data.
* CockroachDB does not support SVG.
#### Before you begin
* Install a build of CockroachDB with support for spatial data by following the instructions at Install CockroachDB.
* Start a local insecure cluster and connect to that cluster from a SQL client:
```shell theme={"theme":{"light":"catppuccin-mocha","dark":"catppuccin-mocha"}}
cockroach sql --insecure --host=localhost --port=26257
```
Leave this shell open for use in the examples below.
#### Step 1. Load the NYC data
Clone the data set:
```shell theme={"theme":{"light":"catppuccin-mocha","dark":"catppuccin-mocha"}}
git clone https://github.com/otan-cockroach/otan-scripts
```
Load the SQL files into your CockroachDB cluster:
```shell theme={"theme":{"light":"catppuccin-mocha","dark":"catppuccin-mocha"}}
cat otan-scripts/geospatial_sql/*.sql | cockroach sql --insecure --host=localhost --port=26257
```
The command above will take a few minutes to run.
#### Step 2. Follow the PostGIS tutorial
When the cluster is finished loading the data, open a SQL shell and start working through the [Introduction to PostGIS](https://postgis.net/workshops/postgis-intro/) tutorial:
```shell theme={"theme":{"light":"catppuccin-mocha","dark":"catppuccin-mocha"}}
cockroach sql --insecure --host=localhost --port=26257
```
### Use a sample Shapefile dataset
This page has instructions for querying spatial data imported into CockroachDB. On this page, we use a sample Shapefile dataset from the National Oceanic and Atmospheric Administration.
#### Before you begin
* Install a build of CockroachDB with support for spatial data by following the instructions at Install CockroachDB.
* Start a local insecure cluster and connect to that cluster from a SQL client:
```shell theme={"theme":{"light":"catppuccin-mocha","dark":"catppuccin-mocha"}}
cockroach sql --insecure --host=localhost --port=26257
```
Leave this shell open for use in the example below.
#### Step 1. Import spatial data
Import some sample spatial data into CockroachDB by following the instructions at Migrate from Shapefiles.
#### Step 2. Query spatial data
After you have imported the sample tornado data into CockroachDB, you can query the spatial data from SQL.
For example, we may be interested in the [1999 Oklahoma tornado outbreak](https://wikipedia.org/wiki/1999_Oklahoma_tornado_outbreak), which is described by Wikipedia as:
> a significant tornado outbreak that affected much of the Central and parts of the Eastern United States, with the highest record-breaking wind speeds of 302 ± 22 mph (486 ± 35 km/h). During this week-long event, 154 tornadoes touched down (including one in Canada), more than half of them on May 3 and 4 when activity reached its peak over Oklahoma, Kansas, Nebraska, Texas, and Arkansas.
According to the wiki page linked above, there were 152 tornadoes confirmed between May 2-8, 1999 (one in Canada).
We can try to verify this number against the NWS's tornado data set with the following query:
```sql theme={"theme":{"light":"catppuccin-mocha","dark":"catppuccin-mocha"}}
SELECT COUNT(*) FROM "1950-2018-torn-initpoint" WHERE yr = 1999 AND mo = 5 AND dy >= 02 AND dy <= 08;
```
```
count
---------
150
(1 row)
```
It might be interesting to look into why these numbers are different!
Next, let's get a list of starting points for all of the tornadoes in the outbreak that started in Oklahoma:
```sql theme={"theme":{"light":"catppuccin-mocha","dark":"catppuccin-mocha"}}
SELECT ST_AsText(geom) FROM "1950-2018-torn-initpoint" WHERE yr = 1999 AND st = 'OK' AND mo = 5 AND dy > 02 AND dy <= 08;
```
```
st_astext
--------------------------------------------------
POINT (-98.379999999999995 34.770000000000003)
POINT (-98.329999999999998 34.780000000000001)
POINT (-98.319999999999993 34.880000000000003)
POINT (-98.230000000000004 34.920000000000002)
POINT (-99.019999999999996 34.799999999999997)
POINT (-98.25 35.030000000000001)
POINT (-98.120000000000005 34.969999999999999)
POINT (-98.030000000000001 35.049999999999997)
POINT (-97.980000000000004 35.079999999999998)
POINT (-98.569999999999993 34.950000000000003)
POINT (-97.849999999999994 35.130000000000003)
POINT (-98.430000000000007 34.979999999999997)
POINT (-98.329999999999998 35.07)
POINT (-98.019999999999996 35.719999999999999)
POINT (-97.980000000000004 35.719999999999999)
POINT (-97.599999999999994 35.299999999999997)
POINT (-98.280000000000001 35.119999999999997)
POINT (-98.200000000000003 35.170000000000002)
POINT (-97.400000000000006 35.399999999999999)
POINT (-98.099999999999994 35.18)
POINT (-98.069999999999993 35.270000000000003)
POINT (-98.129999999999995 35.270000000000003)
POINT (-98.019999999999996 35.32)
POINT (-97.299999999999997 35.469999999999999)
POINT (-98 35.270000000000003)
POINT (-97.969999999999999 35.399999999999999)
POINT (-97.219999999999999 35.549999999999997)
POINT (-97.920000000000002 35.420000000000002)
POINT (-97.900000000000006 35.43)
POINT (-97.230000000000004 35.579999999999998)
POINT (-98.370000000000005 35.880000000000003)
POINT (-97.920000000000002 35.520000000000003)
POINT (-98.280000000000001 35.649999999999999)
POINT (-97.849999999999994 35.530000000000001)
POINT (-97.200000000000003 35.130000000000003)
POINT (-97.780000000000001 35.649999999999999)
POINT (-98.030000000000001 35.850000000000001)
POINT (-97.719999999999999 35.700000000000003)
POINT (-98.030000000000001 35.880000000000003)
POINT (-97 35.369999999999997)
POINT (-97.680000000000007 35.780000000000001)
POINT (-97.950000000000003 35.93)
POINT (-98.170000000000002 35.850000000000001)
POINT (-97.680000000000007 35.880000000000003)
POINT (-97.879999999999995 36.020000000000003)
POINT (-97.950000000000003 36.020000000000003)
POINT (-98 35.5)
POINT (-97.879999999999995 36.100000000000001)
POINT (-97.969999999999999 35.549999999999997)
POINT (-96.799999999999997 35.649999999999999)
POINT (-97.650000000000006 36.119999999999997)
POINT (-98.25 36.299999999999997)
POINT (-97.719999999999999 35.780000000000001)
POINT (-97.780000000000001 35.850000000000001)
POINT (-97.599999999999994 35.920000000000002)
POINT (-97.420000000000002 36.030000000000001)
POINT (-96.129999999999995 35.979999999999997)
POINT (-96.069999999999993 36.020000000000003)
POINT (-95.650000000000006 35.630000000000003)
POINT (-95.180000000000007 35.950000000000003)
POINT (-94.730000000000004 36)
POINT (-97.400000000000006 35.32)
POINT (-96.400000000000006 36.469999999999999)
POINT (-95.579999999999998 34.579999999999998)
POINT (-95.219999999999999 34.880000000000003)
POINT (-95 35.130000000000003)
POINT (-94.780000000000001 35.299999999999997)
POINT (-94.700000000000003 35.43)
POINT (-94.549999999999997 35.57)
(69 rows)
```
We can see that almost half of all of the tornadoes in this outbreak began in Oklahoma.
It might be interesting to draw these points on a map. The image below shows the points from the query above drawn as a simple polygon on a map of Oklahoma. The boxes around the polygon show the spatial index coverings for the polygon.
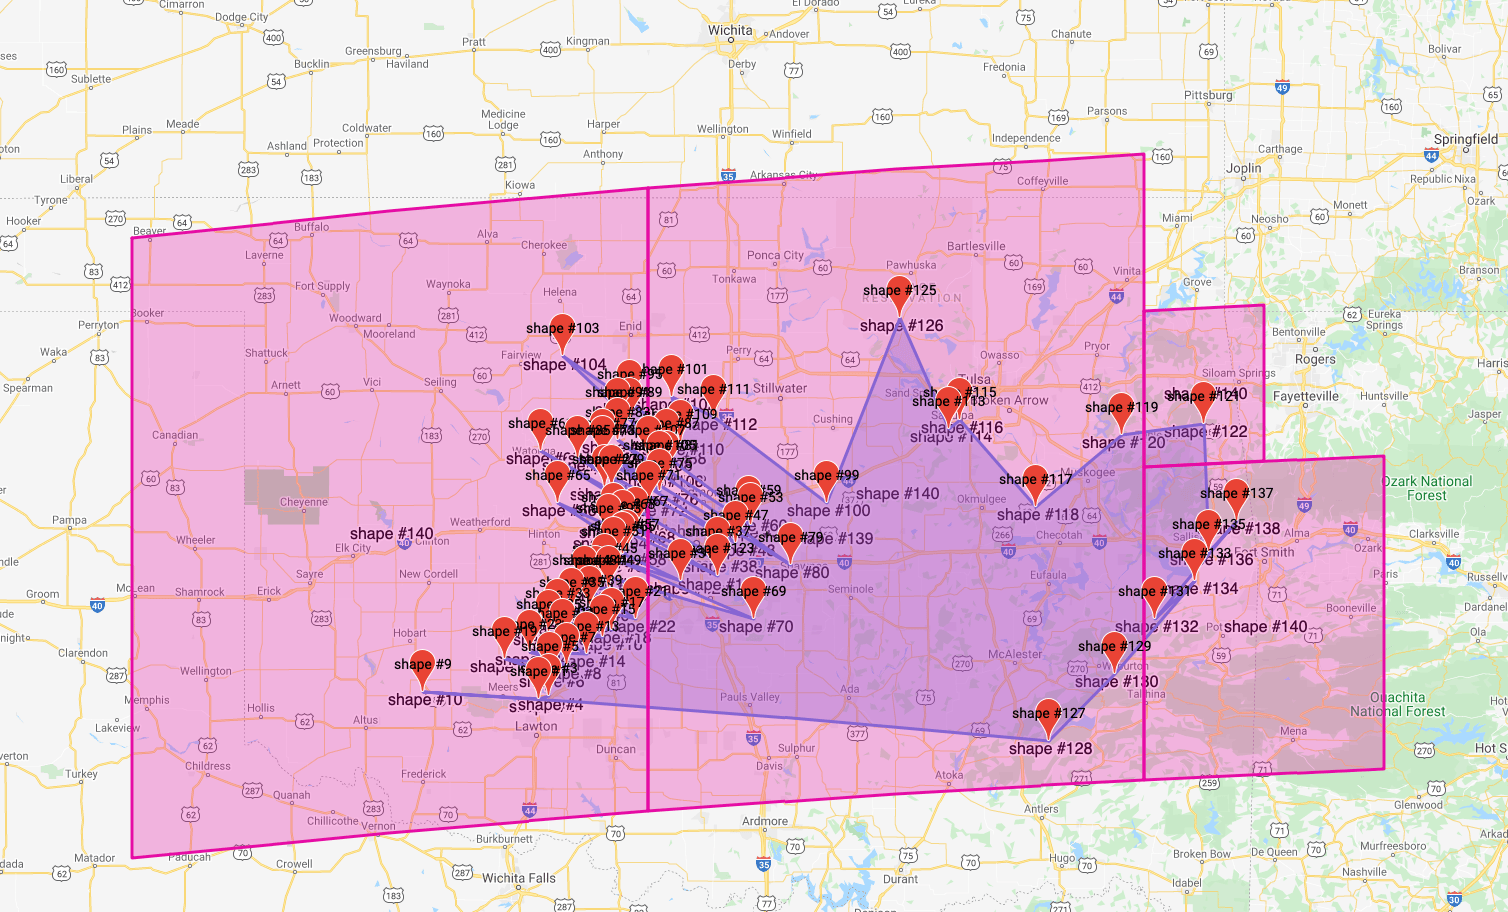 (Map data © 2020 Google)
## See also
* Spatial Data Overview
* Spatial indexes
* Spatial & GIS Glossary of Terms
* Migrate from Shapefiles
* Migrate from GeoJSON
* Migrate from GeoPackage
* Migrate from OpenStreetMap
* Spatial functions
(Map data © 2020 Google)
## See also
* Spatial Data Overview
* Spatial indexes
* Spatial & GIS Glossary of Terms
* Migrate from Shapefiles
* Migrate from GeoJSON
* Migrate from GeoPackage
* Migrate from OpenStreetMap
* Spatial functions