> ## Documentation Index
> Fetch the complete documentation index at: https://cockroachlabs.mintlify.site/llms.txt
> Use this file to discover all available pages before exploring further.
# Detect Hotspots
export const InternalLink = ({version, path = "", children, ...props}) => {
let detectedVersion = version || "stable";
if (typeof window !== 'undefined' && !version) {
const match = window.location.pathname.match(/\/docs\/([^/]+)/);
if (match) {
detectedVersion = match[1];
}
}
const normalizedPath = path.startsWith("/") ? path.slice(1) : path;
return
{children}
;
};
This page provides practical guidance on identifying common hotspots in CockroachDB clusters using real-time monitoring and historical logs. This tutorial assumes that you have identified a [metrics outlier](#step-1-check-for-a-node-outlier-in-metrics) in your cluster. It focuses on CPU and latch contention metrics to help you identify [hot key](#mitigation-1-hot-key) and [hot index](#mitigation-2-hot-index) scenarios.
## Before you begin
* Review the Understand hotspots page for definitions and concepts.
* Ensure you have access to the DB Console Metrics and the relevant logs.
## Troubleshooting overview
The following sections provide detailed instructions for identifying potential hotspots and applying mitigations.
 ## Step 1. Check for a node outlier in metrics
To identify a hotspot, monitor the following metrics on the DB Console **Metrics** page and the DB Console **Advanced Debug Custom Chart** page. A node with a maximum value that is a clear outlier in the cluster may indicate a potential hotspot.
### A. Latch conflict wait durations
1. Navigate to the DB Console **Advanced Debug Custom Chart** page.
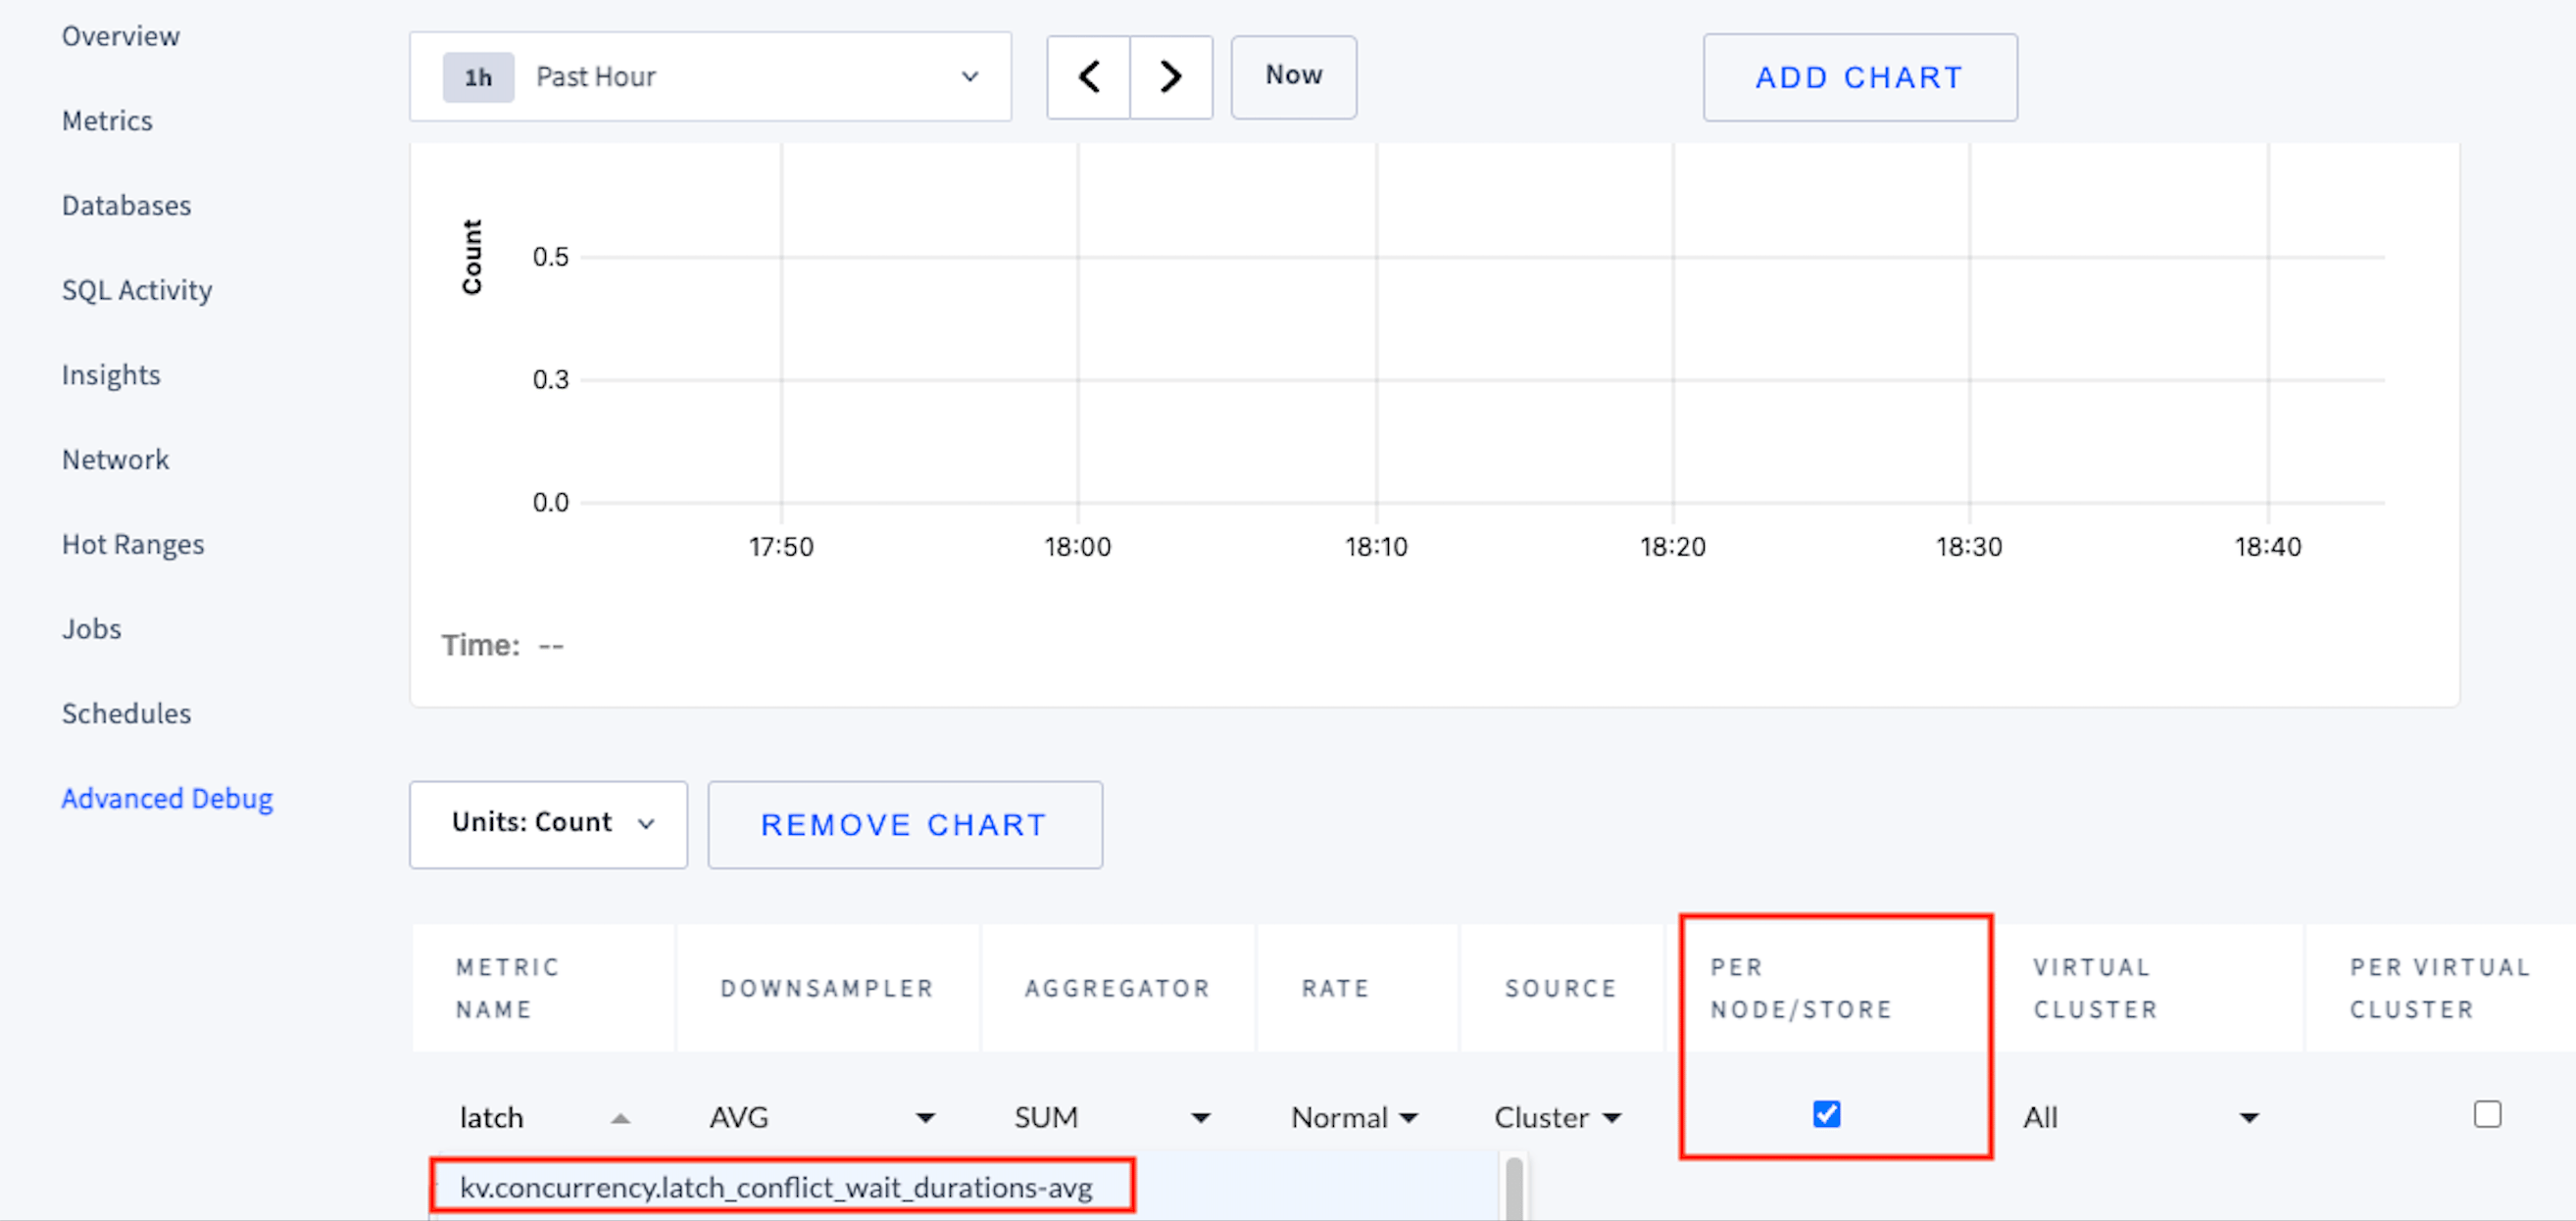
2. Create a custom chart to monitor the `kv.concurrency.latch_conflict_wait_durations-avg` metric, which tracks time spent on latch acquisition waiting for conflicts with other latches. For example, a sequence that writes to the same row must wait to acquire the latch.
3. To display the metric per node, select the `PER NODE/STORE` checkbox as shown:
## Step 1. Check for a node outlier in metrics
To identify a hotspot, monitor the following metrics on the DB Console **Metrics** page and the DB Console **Advanced Debug Custom Chart** page. A node with a maximum value that is a clear outlier in the cluster may indicate a potential hotspot.
### A. Latch conflict wait durations
1. Navigate to the DB Console **Advanced Debug Custom Chart** page.
2. Create a custom chart to monitor the `kv.concurrency.latch_conflict_wait_durations-avg` metric, which tracks time spent on latch acquisition waiting for conflicts with other latches. For example, a sequence that writes to the same row must wait to acquire the latch.
3. To display the metric per node, select the `PER NODE/STORE` checkbox as shown:
 4. Is there a node with a maximum value that is a clear outlier in the cluster for the latch conflict wait durations metric?
* If **Yes**, note the ID of the hot node and the time period when it was hot. Proceed to check for a [`popular key detected `log](#a-popular-key-detected).
* If **No**, check for a node outlier in the [CPU percent](#b-cpu-percent) metric.
### B. CPU percent
1. Navigate to the DB Console **Metrics** page **Hardware** dashboard.
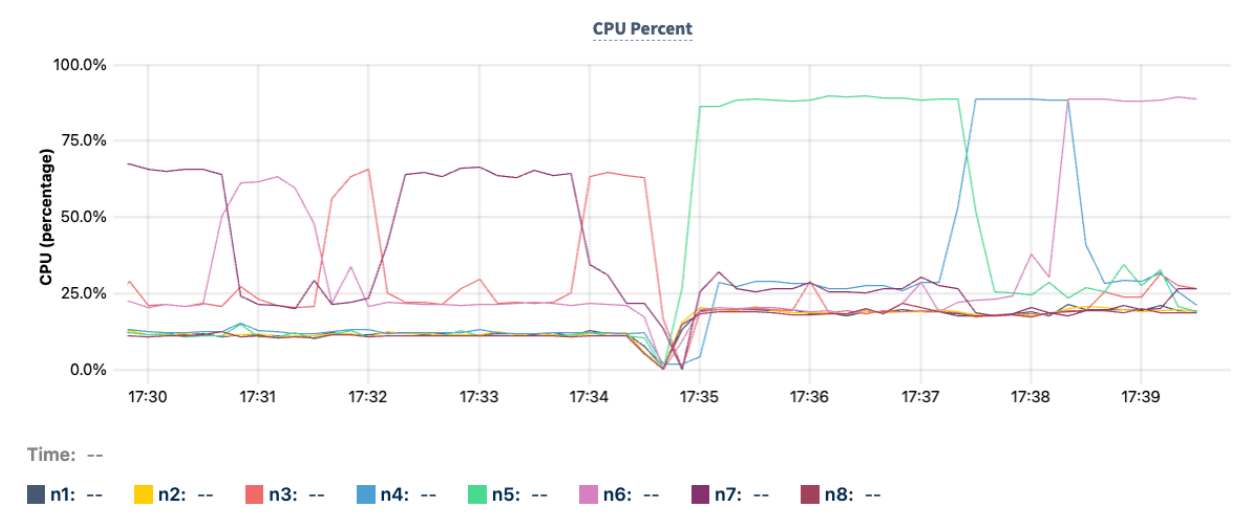
2. Monitor the **CPU Percent** graph. CPU usage typically increases with traffic volume.
3. Check if the CPU usage of the hottest node is 20% or more above the cluster average. For example, node `n5`, represented by the green line in the following **CPU Percent** graph, hovers at around 87% at time 17:35 compared to other nodes that hover around 20% to 25%.
4. Is there a node with a maximum value that is a clear outlier in the cluster for the latch conflict wait durations metric?
* If **Yes**, note the ID of the hot node and the time period when it was hot. Proceed to check for a [`popular key detected `log](#a-popular-key-detected).
* If **No**, check for a node outlier in the [CPU percent](#b-cpu-percent) metric.
### B. CPU percent
1. Navigate to the DB Console **Metrics** page **Hardware** dashboard.
2. Monitor the **CPU Percent** graph. CPU usage typically increases with traffic volume.
3. Check if the CPU usage of the hottest node is 20% or more above the cluster average. For example, node `n5`, represented by the green line in the following **CPU Percent** graph, hovers at around 87% at time 17:35 compared to other nodes that hover around 20% to 25%.
 4. Is there a node with a maximum value that is a clear outlier in the cluster for the CPU percent metric?
* If **Yes**, note the ID of the hot node and the time period when it was hot. Proceed to check for a [`popular key detected `log](#a-popular-key-detected).
* If **No**, and the metrics outlier appears in a metric other than CPU percent or latch conflict wait duration, consider causes other than a hotspot.
## Step 2. Check for existence of `no split key found` log
The `no split key found` log is emitted in the `KV_DISTRIBUTION` log channel. This log is only emitted when a single replica begins using a significant percentage of the resources on the node where it resides.
This log is not associated with a specific event type but includes an unstructured message, for example:
```
I250523 21:59:25.755283 31560 13@kv/kvserver/split/decider.go:298 ⋮ [T1,Vsystem,n5,s5,r1115/3:‹/Table/106/1/{113338-899841…}›] 2979 no split key found: insufficient counters = 0, imbalance = 20, most popular key occurs in 36% of samples, access balance right-biased 98%, popular key detected, clear direction detected
```
In the preceding log example, the square-bracketed tag section provides the following information:
* Node ID: `n5` indicates the Node ID is 5.
* Range ID: `r1115` indicates the Range ID is 1115.
The timestamp at the beginning of the log is `250523 21:59:25.755283`.
The unstructured message ends with one of the following strings:
1. `popular key detected, clear direction detected`
2. `popular key detected, no clear direction`
3. `no popular key, clear direction detected`
4. `no popular key, no clear direction`
### A. `popular key detected`
The `popular key detected` log indicates that a significant percentage of reads or writes target a single row within a range.
1. To check for a `popular key detected` log, search the `KV_DISTRIBUTION` logs on the hot node from [Step 1](#step-1-check-for-a-node-outlier-in-metrics) within the noted time period.
2. Once you identify a relevant log, note the range ID in the tag section of the log.
3. If the outlier appears in the [latch conflict wait durations metric](#a-latch-conflict-wait-durations), does a `popular key detected` log exist?
* If **Yes**, it may be a write hotspot. Note the range ID of `popular key detected` log and proceed to find the corresponding [hot ranges log](#step-3-find-hot-ranges-log).
* If **No**, investigate other reasons for the latch conflict wait durations metric outlier.
1. If the outlier appears in the [CPU percent metric](#b-cpu-percent), does a `popular key detected` log exist?
* If **Yes**, it may be a read hotspot, because the write hotspot was ruled out when no outlier was found in the [latch conflict wait durations metric](#a-latch-conflict-wait-durations). The order of operations in this troubleshooting process matters. Note the range ID of `popular key detected` log and proceed to find the corresponding [hot ranges log](#step-3-find-hot-ranges-log).
* If **No**, check whether a [`clear direction detected` log](#b-clear-direction-detected) exists.
### B. `clear direction detected`
The `clear direction detected` log indicates that the rows touched in the range are steadily increasing or decreasing within the index.
* To determine whether a `clear direction detected` log exists, check whether any `no split key found` logs for the hot node identified in [Step 1](#step-1-check-for-a-node-outlier-in-metrics), within the noted time period, have an unstructured message that ends with `clear direction detected`.
* Does a `clear direction detected` log exist?
* If **Yes**, it may be an index hotspot. Note the range ID of `clear direction detected` log and proceed to find the corresponding [hot ranges log](#step-3-find-hot-ranges-log).
* If **No**, investigate other possible causes for CPU skew.
## Step 3. Find hot ranges log
A hot ranges log is a log of an event of type `hot_ranges_stats` emitted to the `HEALTH` logging channel. Because this log corresponds to an event type, it includes a structured message such as:
```
I250602 04:46:54.752464 2023 2@util/log/event_log.go:39 ⋮ [T1,Vsystem,n5] 31977 ={"Timestamp":1748839613749807000,"EventType":"hot_ranges_stats","RangeID":1115,"Qps":0,"LeaseholderNodeID":5,"WritesPerSecond":0.0012048123820978134,"CPUTimePerSecond":251.30338109510822,"Databases":["kv"],"Tables":["kv"],"Indexes":["kv_pkey"]}
```
1. To find the relevant hot ranges log, within the noted time range of the metric outlier, search for
* `"EventType":"hot_ranges_stats"` and
* `"RangeID":{range ID from popular key detected log or clear direction log}` and
* `"LeaseholderNodeID":{node ID from metric outlier}`.
1. Once you find the relevant hot ranges log, note the values for `Databases`, `Tables`, and `Indexes`.
2. For a write hotspot or read hotspot, proceed to [Mitigation for hot key](#mitigation-1-hot-key).
3. For an index hotspot, proceed to [Mitigation for hot index](#mitigation-2-hot-index).
## Mitigation 1 - hot key
To mitigate a hot key (whether a write hotspot or read hotspot), identify the problematic queries and refactor your application accordingly. Use the `Databases`, `Tables`, and `Indexes` values from the [hot ranges log](#step-3-find-hot-ranges-log) to filter the following DB Console pages by the time period of the metric outlier and log emission:
* The **Databases** Index Details page includes an **Index Usage** section that shows statement fingerprints using that index.
* The **SQL Activity Statements** page shows statement fingerprints that can be filtered.
## Mitigation 2 - hot index
To mitigate a hot index, update the index schema using the values noted for `Databases`, `Tables`, and `Indexes` in the [hot ranges log](#step-3-find-hot-ranges-log). Refer to Resolving index hotspots.
## See also
* Understand Hotspots
* Reduce hotspots
* **Metrics** page
* **Advanced Debug Custom Chart** page
* Logging channels
* Load-based splitting
* **SQL Activity Statements** page
* **Databases** Index Details page
4. Is there a node with a maximum value that is a clear outlier in the cluster for the CPU percent metric?
* If **Yes**, note the ID of the hot node and the time period when it was hot. Proceed to check for a [`popular key detected `log](#a-popular-key-detected).
* If **No**, and the metrics outlier appears in a metric other than CPU percent or latch conflict wait duration, consider causes other than a hotspot.
## Step 2. Check for existence of `no split key found` log
The `no split key found` log is emitted in the `KV_DISTRIBUTION` log channel. This log is only emitted when a single replica begins using a significant percentage of the resources on the node where it resides.
This log is not associated with a specific event type but includes an unstructured message, for example:
```
I250523 21:59:25.755283 31560 13@kv/kvserver/split/decider.go:298 ⋮ [T1,Vsystem,n5,s5,r1115/3:‹/Table/106/1/{113338-899841…}›] 2979 no split key found: insufficient counters = 0, imbalance = 20, most popular key occurs in 36% of samples, access balance right-biased 98%, popular key detected, clear direction detected
```
In the preceding log example, the square-bracketed tag section provides the following information:
* Node ID: `n5` indicates the Node ID is 5.
* Range ID: `r1115` indicates the Range ID is 1115.
The timestamp at the beginning of the log is `250523 21:59:25.755283`.
The unstructured message ends with one of the following strings:
1. `popular key detected, clear direction detected`
2. `popular key detected, no clear direction`
3. `no popular key, clear direction detected`
4. `no popular key, no clear direction`
### A. `popular key detected`
The `popular key detected` log indicates that a significant percentage of reads or writes target a single row within a range.
1. To check for a `popular key detected` log, search the `KV_DISTRIBUTION` logs on the hot node from [Step 1](#step-1-check-for-a-node-outlier-in-metrics) within the noted time period.
2. Once you identify a relevant log, note the range ID in the tag section of the log.
3. If the outlier appears in the [latch conflict wait durations metric](#a-latch-conflict-wait-durations), does a `popular key detected` log exist?
* If **Yes**, it may be a write hotspot. Note the range ID of `popular key detected` log and proceed to find the corresponding [hot ranges log](#step-3-find-hot-ranges-log).
* If **No**, investigate other reasons for the latch conflict wait durations metric outlier.
1. If the outlier appears in the [CPU percent metric](#b-cpu-percent), does a `popular key detected` log exist?
* If **Yes**, it may be a read hotspot, because the write hotspot was ruled out when no outlier was found in the [latch conflict wait durations metric](#a-latch-conflict-wait-durations). The order of operations in this troubleshooting process matters. Note the range ID of `popular key detected` log and proceed to find the corresponding [hot ranges log](#step-3-find-hot-ranges-log).
* If **No**, check whether a [`clear direction detected` log](#b-clear-direction-detected) exists.
### B. `clear direction detected`
The `clear direction detected` log indicates that the rows touched in the range are steadily increasing or decreasing within the index.
* To determine whether a `clear direction detected` log exists, check whether any `no split key found` logs for the hot node identified in [Step 1](#step-1-check-for-a-node-outlier-in-metrics), within the noted time period, have an unstructured message that ends with `clear direction detected`.
* Does a `clear direction detected` log exist?
* If **Yes**, it may be an index hotspot. Note the range ID of `clear direction detected` log and proceed to find the corresponding [hot ranges log](#step-3-find-hot-ranges-log).
* If **No**, investigate other possible causes for CPU skew.
## Step 3. Find hot ranges log
A hot ranges log is a log of an event of type `hot_ranges_stats` emitted to the `HEALTH` logging channel. Because this log corresponds to an event type, it includes a structured message such as:
```
I250602 04:46:54.752464 2023 2@util/log/event_log.go:39 ⋮ [T1,Vsystem,n5] 31977 ={"Timestamp":1748839613749807000,"EventType":"hot_ranges_stats","RangeID":1115,"Qps":0,"LeaseholderNodeID":5,"WritesPerSecond":0.0012048123820978134,"CPUTimePerSecond":251.30338109510822,"Databases":["kv"],"Tables":["kv"],"Indexes":["kv_pkey"]}
```
1. To find the relevant hot ranges log, within the noted time range of the metric outlier, search for
* `"EventType":"hot_ranges_stats"` and
* `"RangeID":{range ID from popular key detected log or clear direction log}` and
* `"LeaseholderNodeID":{node ID from metric outlier}`.
1. Once you find the relevant hot ranges log, note the values for `Databases`, `Tables`, and `Indexes`.
2. For a write hotspot or read hotspot, proceed to [Mitigation for hot key](#mitigation-1-hot-key).
3. For an index hotspot, proceed to [Mitigation for hot index](#mitigation-2-hot-index).
## Mitigation 1 - hot key
To mitigate a hot key (whether a write hotspot or read hotspot), identify the problematic queries and refactor your application accordingly. Use the `Databases`, `Tables`, and `Indexes` values from the [hot ranges log](#step-3-find-hot-ranges-log) to filter the following DB Console pages by the time period of the metric outlier and log emission:
* The **Databases** Index Details page includes an **Index Usage** section that shows statement fingerprints using that index.
* The **SQL Activity Statements** page shows statement fingerprints that can be filtered.
## Mitigation 2 - hot index
To mitigate a hot index, update the index schema using the values noted for `Databases`, `Tables`, and `Indexes` in the [hot ranges log](#step-3-find-hot-ranges-log). Refer to Resolving index hotspots.
## See also
* Understand Hotspots
* Reduce hotspots
* **Metrics** page
* **Advanced Debug Custom Chart** page
* Logging channels
* Load-based splitting
* **SQL Activity Statements** page
* **Databases** Index Details page