> ## Documentation Index
> Fetch the complete documentation index at: https://cockroachlabs.mintlify.site/llms.txt
> Use this file to discover all available pages before exploring further.
# Monitor CockroachDB Self-Hosted Clusters with Datadog
export const InternalLink = ({version, path = "", children, ...props}) => {
let detectedVersion = version || "stable";
if (typeof window !== 'undefined' && !version) {
const match = window.location.pathname.match(/\/docs\/([^/]+)/);
if (match) {
detectedVersion = match[1];
}
}
const normalizedPath = path.startsWith("/") ? path.slice(1) : path;
return
{children}
;
};
[Datadog](https://www.datadoghq.com/) is a monitoring and security platform for cloud applications. The integration of your CockroachDB self-hosted cluster with Datadog enables data collection and alerting on selected [CockroachDB metrics](https://docs.datadoghq.com/integrations/cockroachdb/?tab=host#data-collected) using the Datadog platform.
This tutorial explores the CockroachDB self-hosted integration with Datadog. For the CockroachDB Cloud integration with Datadog, refer to Monitor CockroachDB Dedicated with Datadog instead of this page.
The integration of your CockroachDB self-hosted cluster with Datadog is powered by the [Datadog Agent](https://app.datadoghq.com/account/settings#agent), and supported by Datadog directly:
* For more information about the integration, see the [Datadog blog post](https://www.datadoghq.com/blog/monitor-cockroachdb-performance-metrics-with-datadog/).
* For more information about using Datadog, see the [Datadog documentation](https://docs.datadoghq.com/).
* If you run into problems with this integration, please file an issue on the [Datadog Agent issue tracker](https://github.com/DataDog/datadog-agent).
In this tutorial, you will enable the CockroachDB integration in Datadog, configure logging and alerting, and visualize data.
## Before you begin
Before you can follow the steps presented in this tutorial, you must have:
* Downloaded and installed the [Datadog Agent](https://app.datadoghq.com/account/settings#agent).
* Started a secure CockroachDB self-hosted cluster.
## Step 1. Enable CockroachDB integration
To enable the CockroachDB check for your installed Datadog Agent, navigate to the [Integrations page](https://app.datadoghq.com/account/settings#integrations) and find CockroachDB in the list of available integrations. Hover over the icon and click **+ Install**.
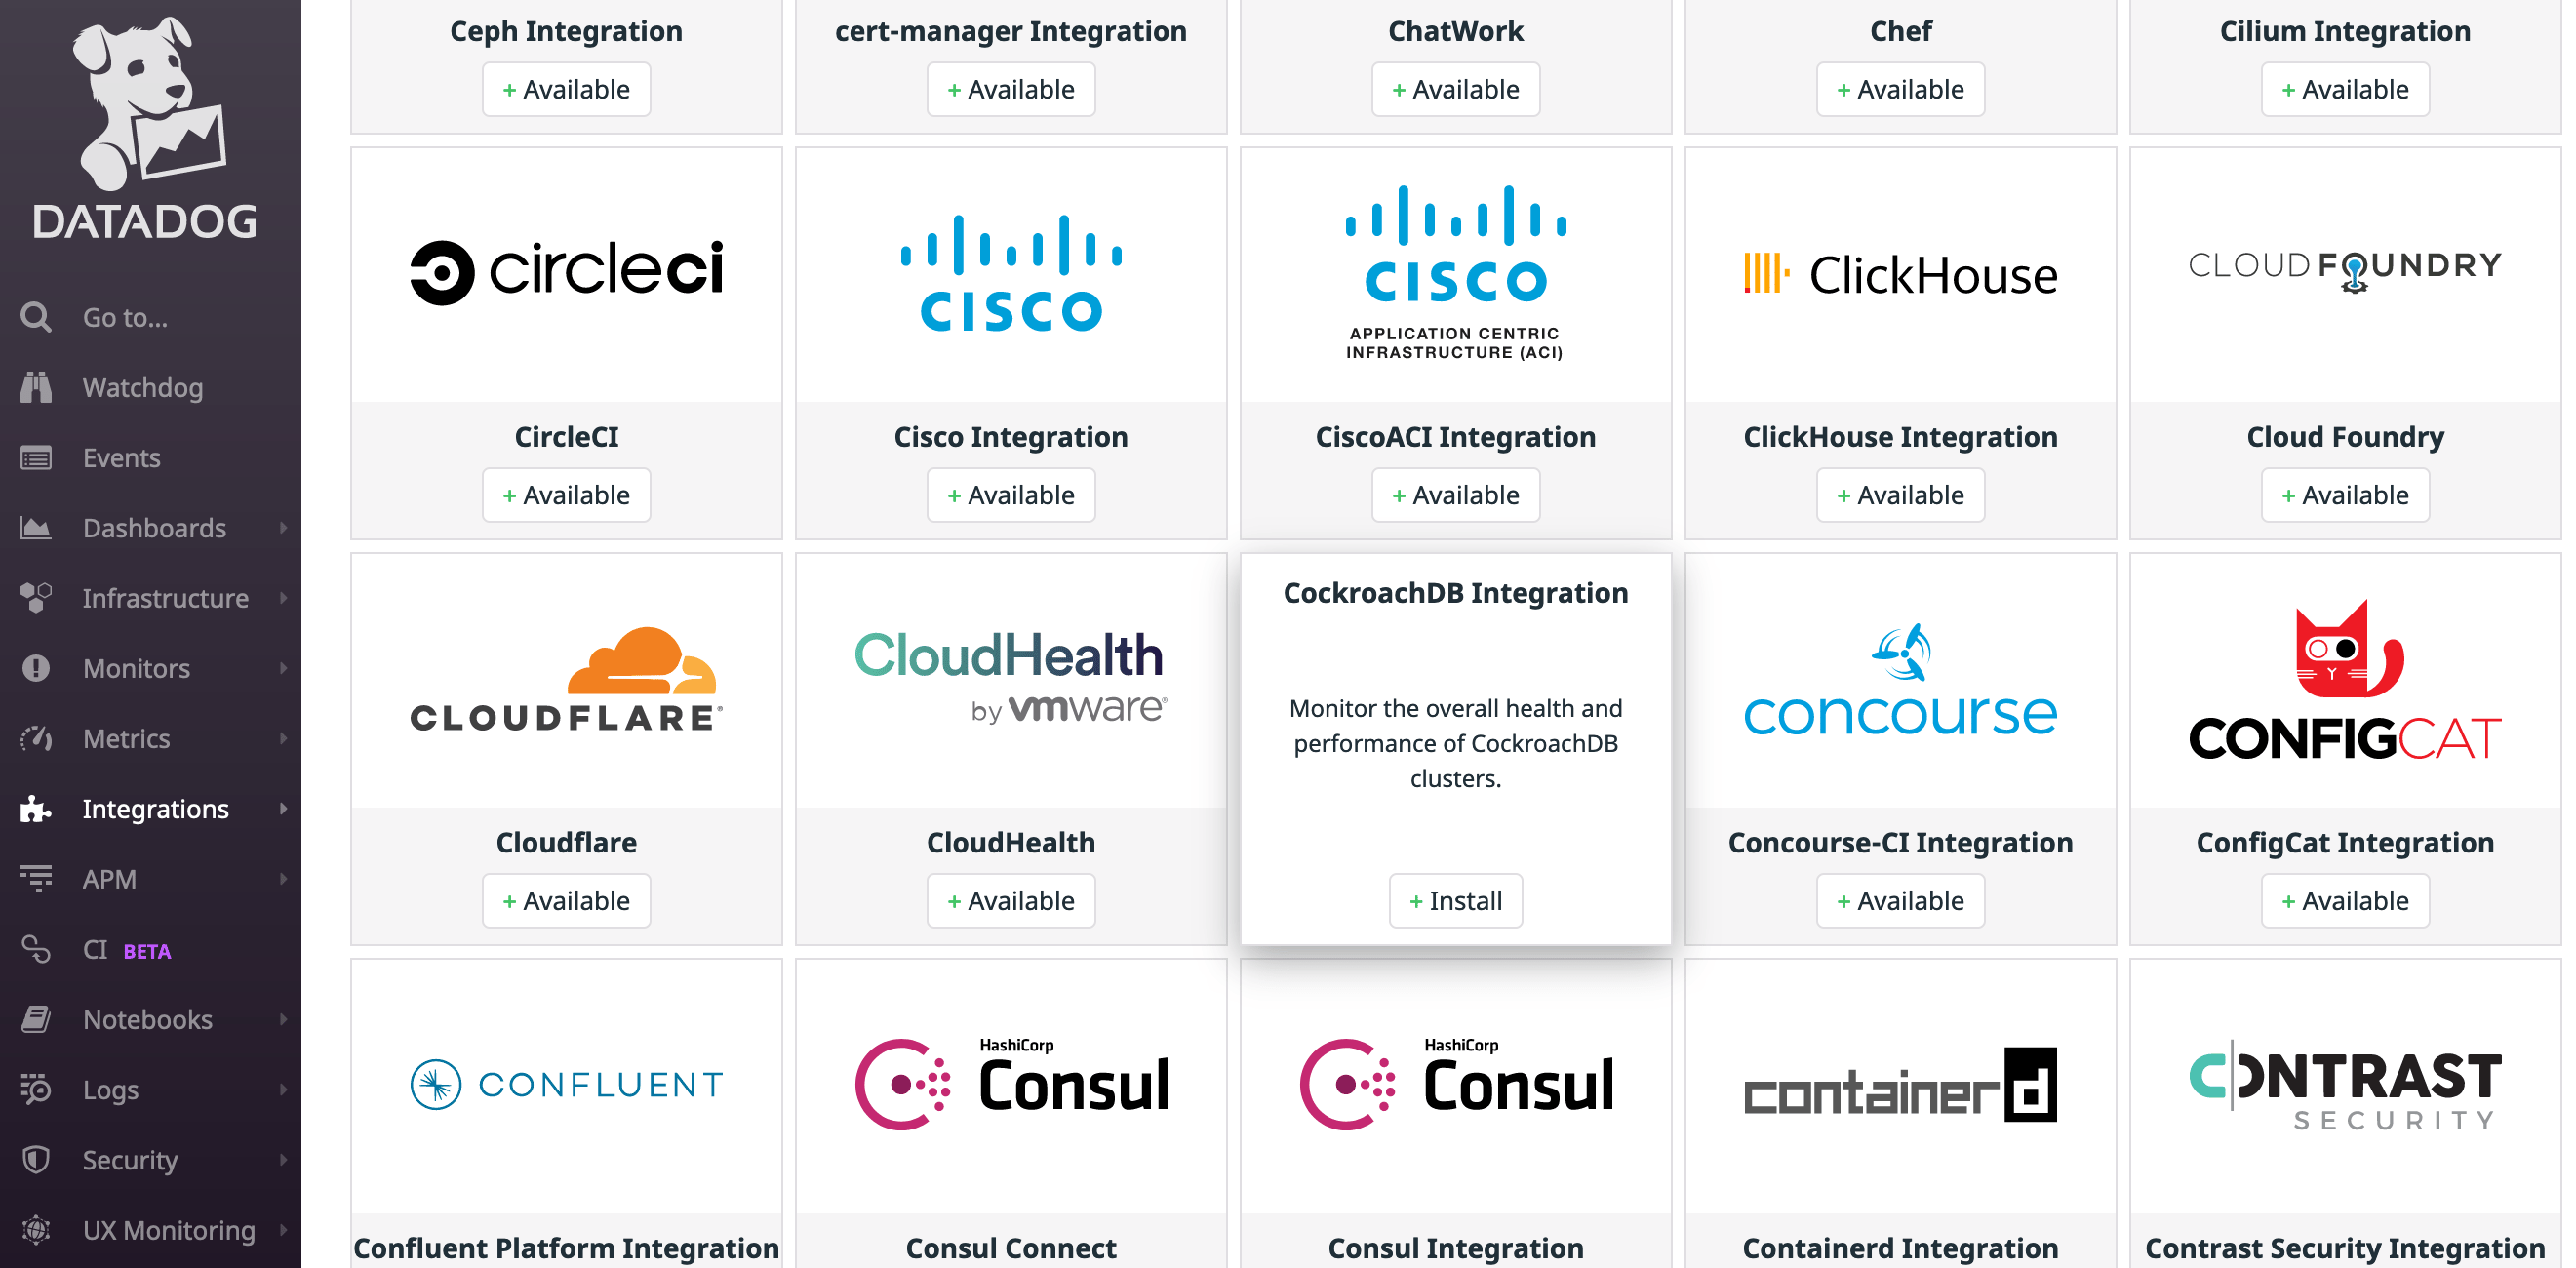 Note that you must restart the Datadog Agent for the change to take effect. CockroachDB will then be listed as an installed integration.
## Step 2. Configure Datadog Agent for CockroachDB
Follow the steps in the [Datadog documentation](https://docs.datadoghq.com/integrations/cockroachdb/?tab=host#configuration) to access and edit your `cockroachdb.d/conf.yaml` file in your Datadog `conf.d/` directory. For all available options, see the sample [`cockroachdb.d/conf.yaml`](https://github.com/DataDog/integrations-core/blob/master/cockroachdb/datadog_checks/cockroachdb/data/conf.yaml.example).
After making the following changes, restart the Datadog Agent to apply them.
### Enable metrics collection
Uncomment the following line in `cockroachdb.d/conf.yaml`:
```yaml theme={"theme":{"light":"catppuccin-mocha","dark":"catppuccin-mocha"}}
- prometheus_url: http://localhost:8080/_status/vars
```
This enables metrics collection via our Prometheus endpoint.
### Configure security certificates
Uncomment the lines that begin with `tls_private_key` and `tls_ca_cert`. These should specify the full file paths to your CA key and certificate, respectively.
For example, if you used `cockroach cert` to secure your cluster, the paths would look something like:
```yaml theme={"theme":{"light":"catppuccin-mocha","dark":"catppuccin-mocha"}}
tls_private_key: /custom/dir/path/client.root.key
```
```yaml theme={"theme":{"light":"catppuccin-mocha","dark":"catppuccin-mocha"}}
tls_ca_cert: /custom/dir/path/ca.crt
```
### Enable log collection
Optionally enable Datadog to collect CockroachDB logs by adding the following block to `cockroachdb.d/conf.yaml`:
```yaml theme={"theme":{"light":"catppuccin-mocha","dark":"catppuccin-mocha"}}
logs:
- type: file
path: /cockroach-data/logs/cockroach.log
source: cockroachdb
service: cockroachdb
log_processing_rules:
- type: multi_line
name: new_log_start_with_status_and_date
pattern: '[A-Z]\d{6}\s\d+\:\d+\:\d+\.\d+'
```
The `path` value specifies the default CockroachDB log file and location.
You can configure both the CockroachDB logging directory and log files.
Log collection is disabled by default in the Datadog Agent. Follow the steps in the [Datadog documentation](https://docs.datadoghq.com/agent/logs/?tab=tailfiles#activate-log-collection) to activate log collection.
## Step 3. Verify Datadog connection to CockroachDB
To apply your configuration changes, ensure that you have restarted the Datadog Agent.
Run the Datadog Agent [`status` subcommand](https://docs.datadoghq.com/agent/guide/agent-commands/?tab=agentv6v7#agent-information) for your platform to verify that the CockroachDB integration is properly connected.
Your output should contain a block like this:
```shell theme={"theme":{"light":"catppuccin-mocha","dark":"catppuccin-mocha"}}
cockroachdb (1.6.0)
-------------------
Instance ID: cockroachdb:42170ecfbfb171c5 [OK]
Configuration Source: file:/opt/datadog-agent/etc/conf.d/cockroachdb.d/conf.yaml
Total Runs: 4
Metric Samples: Last Run: 548, Total: 2,154
Events: Last Run: 0, Total: 0
Service Checks: Last Run: 1, Total: 4
Average Execution Time : 143ms
Last Execution Date : 2021-07-14 12:34:56 EDT / 2021-07-14 16:34:56 UTC (1626280496000)
Last Successful Execution Date : 2021-07-14 12:34:56 EDT / 2021-07-14 16:34:56 UTC (1626280496000)
metadata:
version.major: 21
version.minor: 2
version.patch: 0
version.raw: v25.3.0-alpha.00000000-1724-gc5c74249f7
version.release: alpha.0
version.scheme: semver
```
## Step 4. View CockroachDB dashboards on Datadog
Open your Datadog [Dashboard List](https://app.datadoghq.com/dashboard/lists) and click on `CockroachDB Overview`:
Note that you must restart the Datadog Agent for the change to take effect. CockroachDB will then be listed as an installed integration.
## Step 2. Configure Datadog Agent for CockroachDB
Follow the steps in the [Datadog documentation](https://docs.datadoghq.com/integrations/cockroachdb/?tab=host#configuration) to access and edit your `cockroachdb.d/conf.yaml` file in your Datadog `conf.d/` directory. For all available options, see the sample [`cockroachdb.d/conf.yaml`](https://github.com/DataDog/integrations-core/blob/master/cockroachdb/datadog_checks/cockroachdb/data/conf.yaml.example).
After making the following changes, restart the Datadog Agent to apply them.
### Enable metrics collection
Uncomment the following line in `cockroachdb.d/conf.yaml`:
```yaml theme={"theme":{"light":"catppuccin-mocha","dark":"catppuccin-mocha"}}
- prometheus_url: http://localhost:8080/_status/vars
```
This enables metrics collection via our Prometheus endpoint.
### Configure security certificates
Uncomment the lines that begin with `tls_private_key` and `tls_ca_cert`. These should specify the full file paths to your CA key and certificate, respectively.
For example, if you used `cockroach cert` to secure your cluster, the paths would look something like:
```yaml theme={"theme":{"light":"catppuccin-mocha","dark":"catppuccin-mocha"}}
tls_private_key: /custom/dir/path/client.root.key
```
```yaml theme={"theme":{"light":"catppuccin-mocha","dark":"catppuccin-mocha"}}
tls_ca_cert: /custom/dir/path/ca.crt
```
### Enable log collection
Optionally enable Datadog to collect CockroachDB logs by adding the following block to `cockroachdb.d/conf.yaml`:
```yaml theme={"theme":{"light":"catppuccin-mocha","dark":"catppuccin-mocha"}}
logs:
- type: file
path: /cockroach-data/logs/cockroach.log
source: cockroachdb
service: cockroachdb
log_processing_rules:
- type: multi_line
name: new_log_start_with_status_and_date
pattern: '[A-Z]\d{6}\s\d+\:\d+\:\d+\.\d+'
```
The `path` value specifies the default CockroachDB log file and location.
You can configure both the CockroachDB logging directory and log files.
Log collection is disabled by default in the Datadog Agent. Follow the steps in the [Datadog documentation](https://docs.datadoghq.com/agent/logs/?tab=tailfiles#activate-log-collection) to activate log collection.
## Step 3. Verify Datadog connection to CockroachDB
To apply your configuration changes, ensure that you have restarted the Datadog Agent.
Run the Datadog Agent [`status` subcommand](https://docs.datadoghq.com/agent/guide/agent-commands/?tab=agentv6v7#agent-information) for your platform to verify that the CockroachDB integration is properly connected.
Your output should contain a block like this:
```shell theme={"theme":{"light":"catppuccin-mocha","dark":"catppuccin-mocha"}}
cockroachdb (1.6.0)
-------------------
Instance ID: cockroachdb:42170ecfbfb171c5 [OK]
Configuration Source: file:/opt/datadog-agent/etc/conf.d/cockroachdb.d/conf.yaml
Total Runs: 4
Metric Samples: Last Run: 548, Total: 2,154
Events: Last Run: 0, Total: 0
Service Checks: Last Run: 1, Total: 4
Average Execution Time : 143ms
Last Execution Date : 2021-07-14 12:34:56 EDT / 2021-07-14 16:34:56 UTC (1626280496000)
Last Successful Execution Date : 2021-07-14 12:34:56 EDT / 2021-07-14 16:34:56 UTC (1626280496000)
metadata:
version.major: 21
version.minor: 2
version.patch: 0
version.raw: v25.3.0-alpha.00000000-1724-gc5c74249f7
version.release: alpha.0
version.scheme: semver
```
## Step 4. View CockroachDB dashboards on Datadog
Open your Datadog [Dashboard List](https://app.datadoghq.com/dashboard/lists) and click on `CockroachDB Overview`:
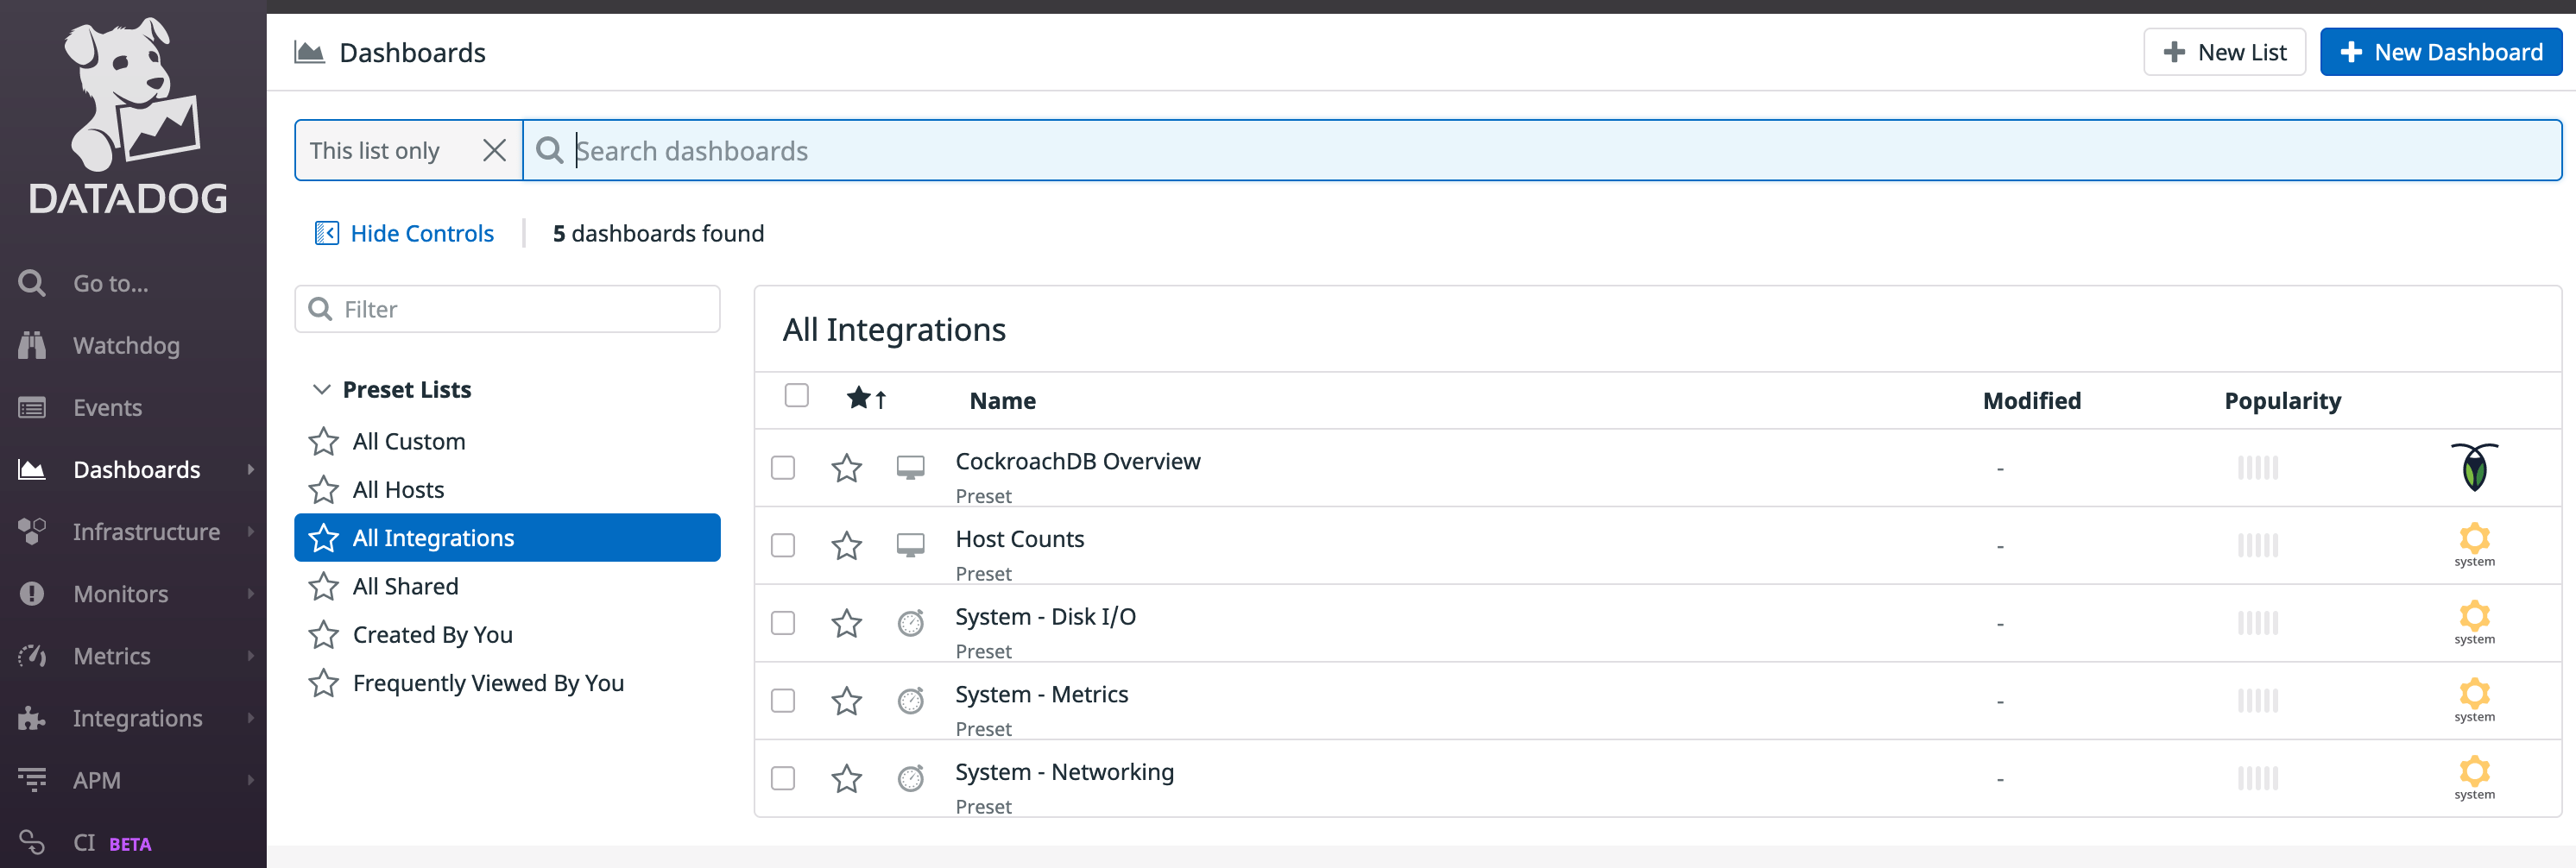 This sample dashboard presents metrics on cluster availability, query performance, and resource usage:
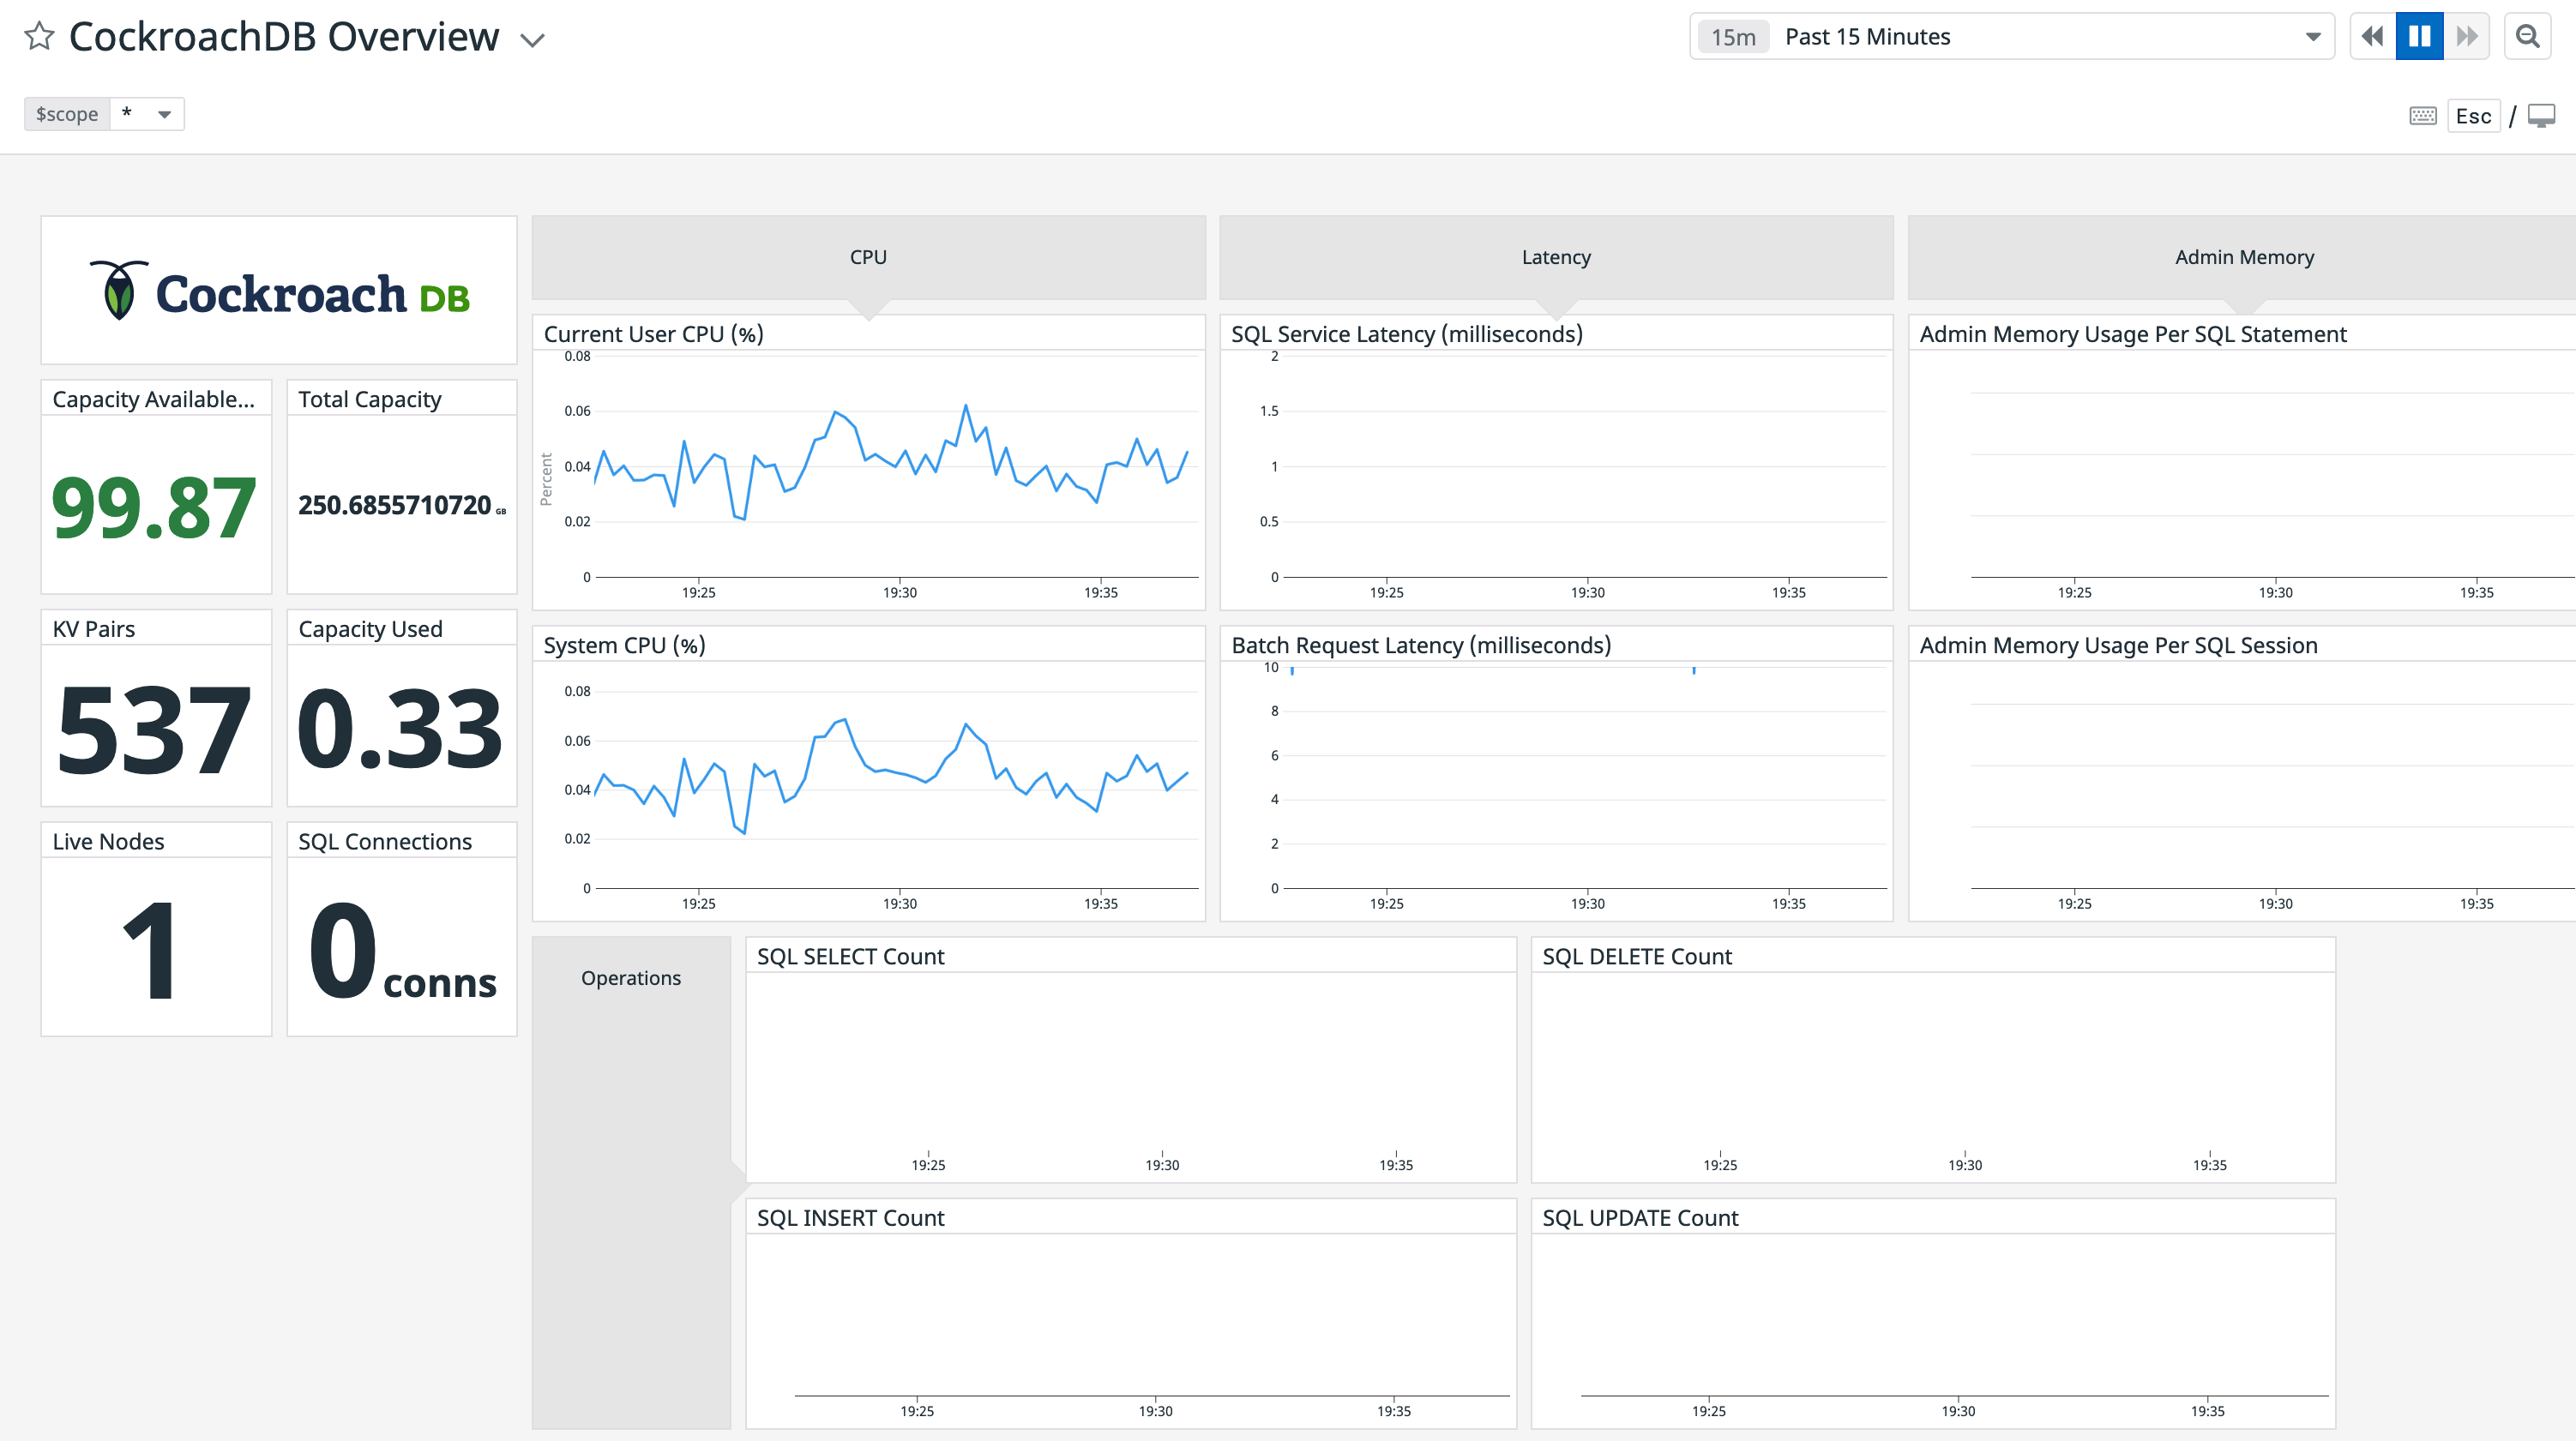 If you wish to customize your CockroachDB dashboard, it's recommended that you clone the default `CockroachDB Overview` dashboard before adding and removing widgets. If you leave the default dashboard intact, Datadog will update it when new versions of the integration's dashboard are released.
## Step 5. Run a sample workload
To test the dashboard functionality, use `cockroach workload` to run a sample workload on the cluster.
Initialize the workload for MovR, a fictional vehicle-sharing company:
```shell theme={"theme":{"light":"catppuccin-mocha","dark":"catppuccin-mocha"}}
cockroach workload init movr 'postgresql://root@localhost:26257?sslcert=certs%2Fclient.root.crt&sslkey=certs%2Fclient.root.key&sslmode=verify-full&sslrootcert=certs%2Fca.crt'
```
Run the MovR workload for 5 minutes:
```shell theme={"theme":{"light":"catppuccin-mocha","dark":"catppuccin-mocha"}}
cockroach workload run movr --duration=5m 'postgresql://root@localhost:26257?sslcert=certs%2Fclient.root.crt&sslkey=certs%2Fclient.root.key&sslmode=verify-full&sslrootcert=certs%2Fca.crt'
```
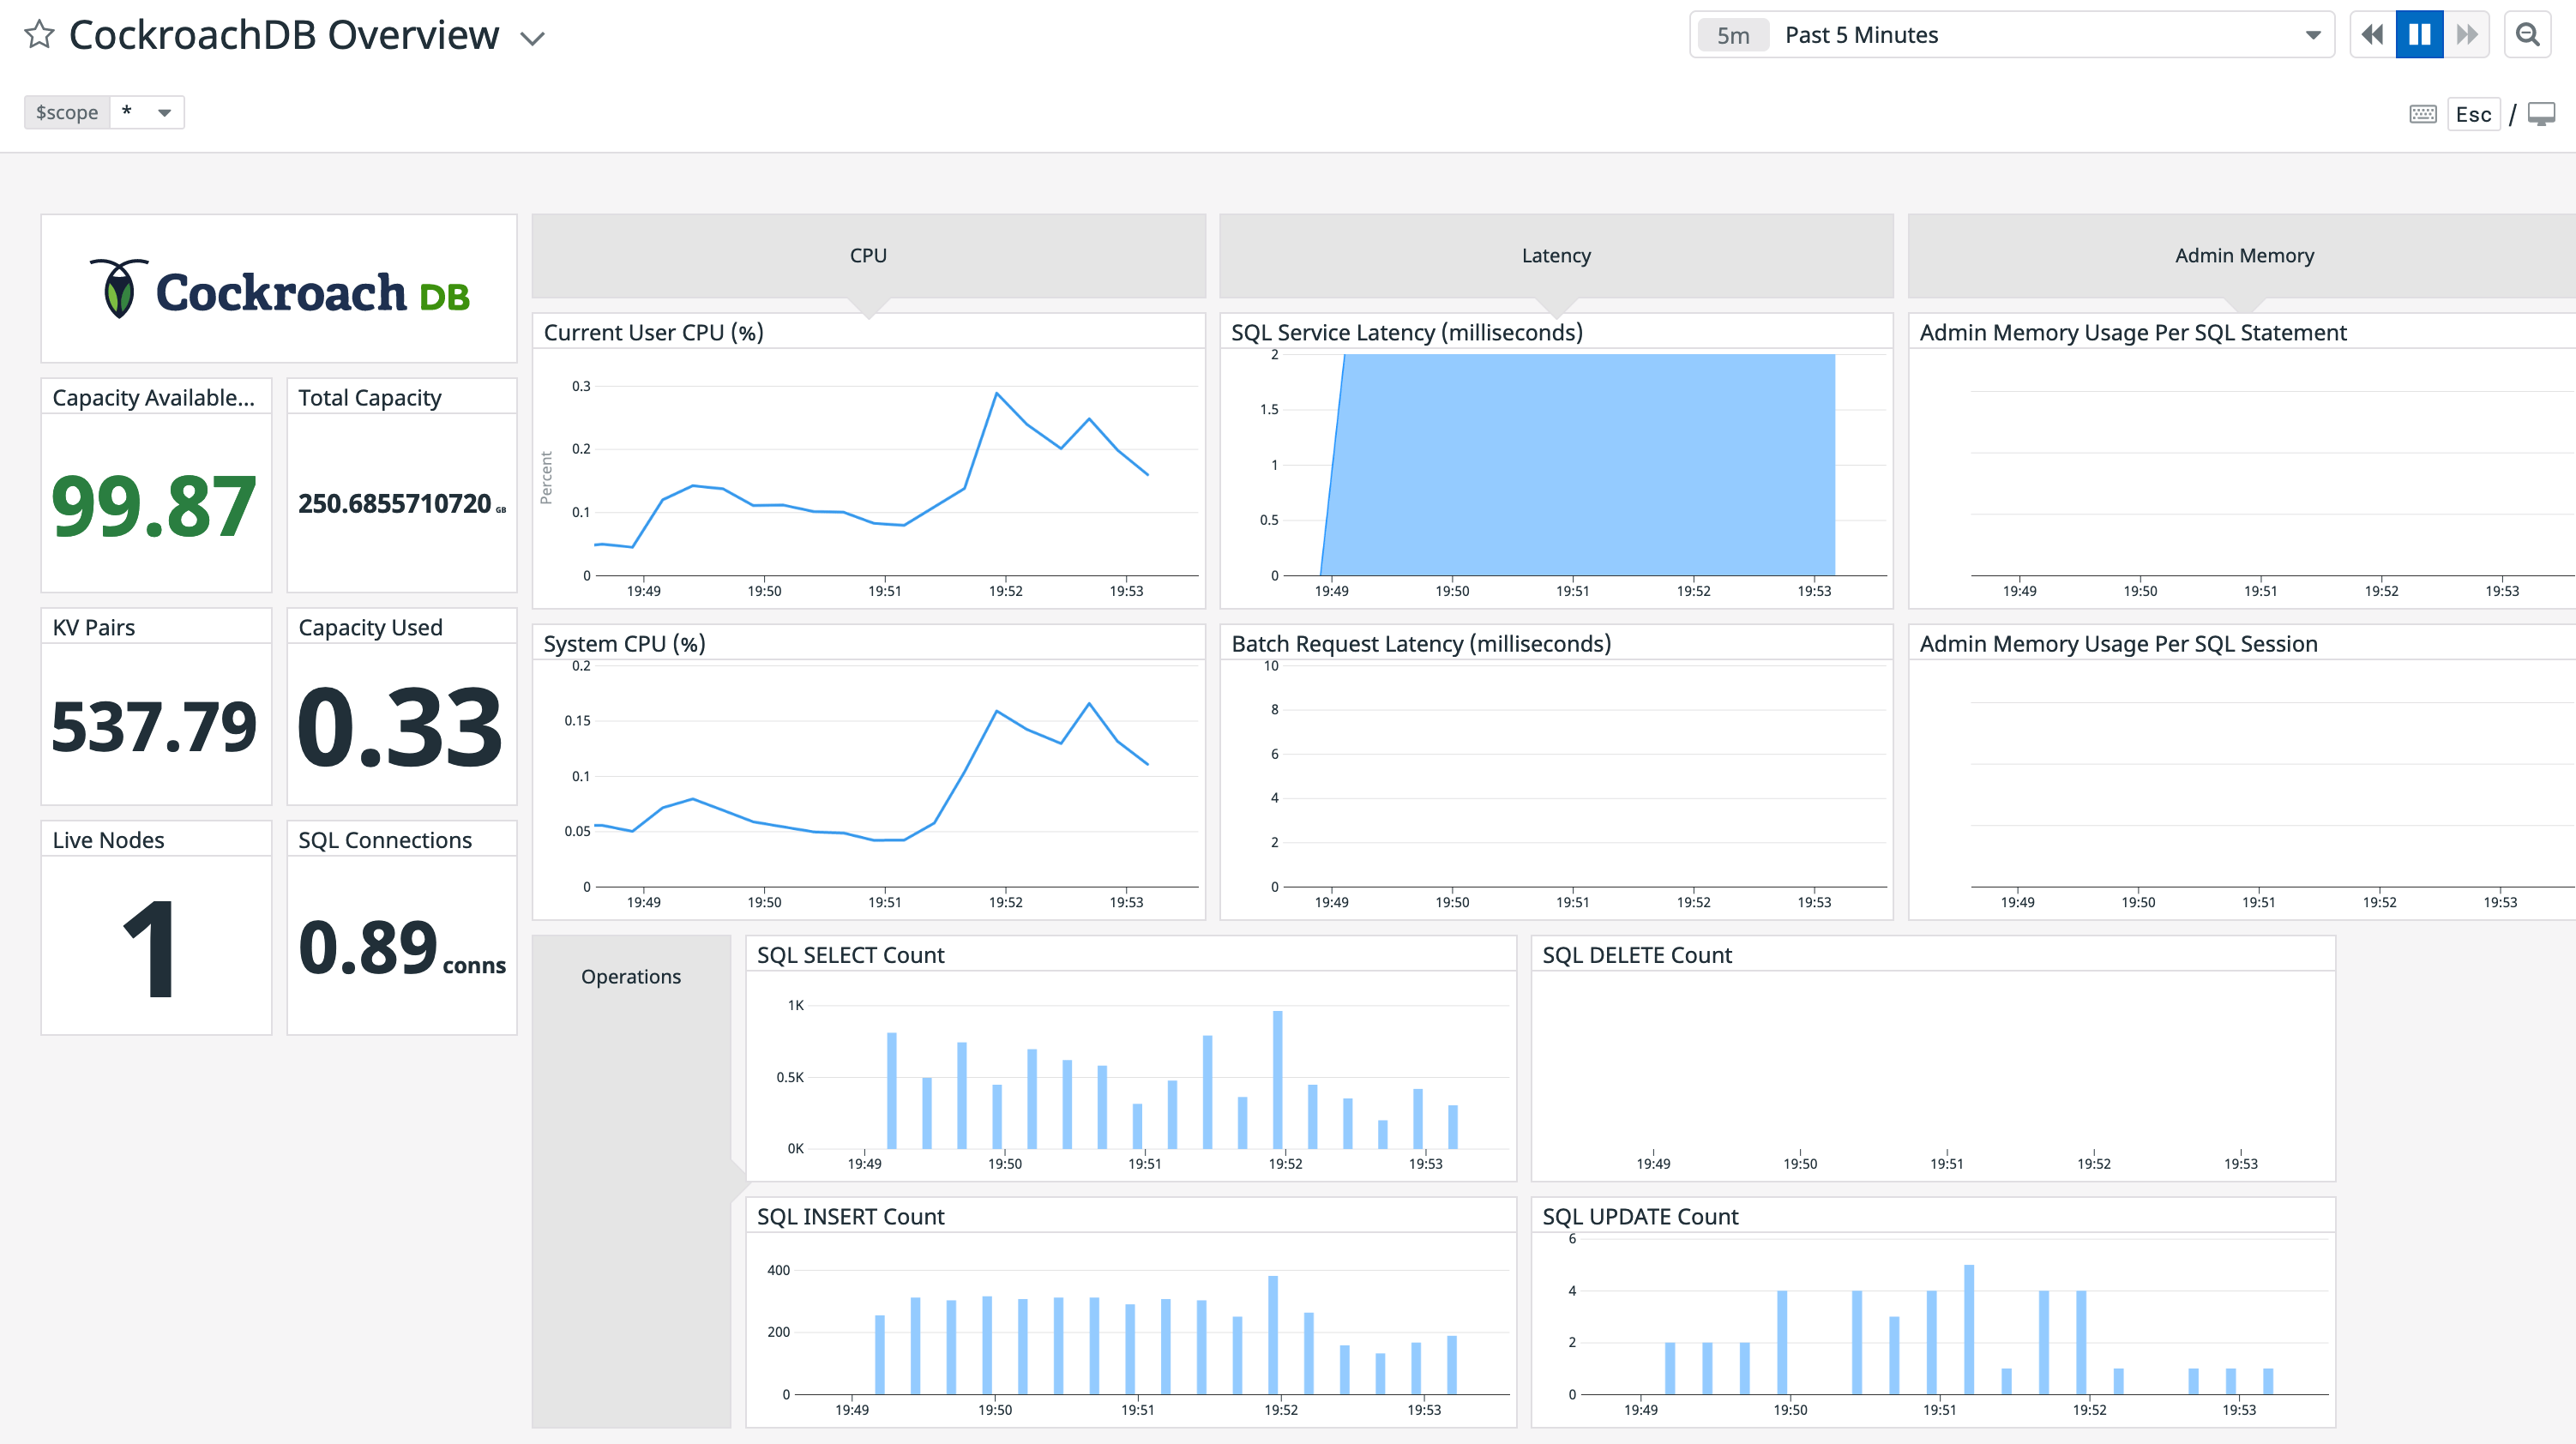
The query metrics will appear on the dashboard:
If you wish to customize your CockroachDB dashboard, it's recommended that you clone the default `CockroachDB Overview` dashboard before adding and removing widgets. If you leave the default dashboard intact, Datadog will update it when new versions of the integration's dashboard are released.
## Step 5. Run a sample workload
To test the dashboard functionality, use `cockroach workload` to run a sample workload on the cluster.
Initialize the workload for MovR, a fictional vehicle-sharing company:
```shell theme={"theme":{"light":"catppuccin-mocha","dark":"catppuccin-mocha"}}
cockroach workload init movr 'postgresql://root@localhost:26257?sslcert=certs%2Fclient.root.crt&sslkey=certs%2Fclient.root.key&sslmode=verify-full&sslrootcert=certs%2Fca.crt'
```
Run the MovR workload for 5 minutes:
```shell theme={"theme":{"light":"catppuccin-mocha","dark":"catppuccin-mocha"}}
cockroach workload run movr --duration=5m 'postgresql://root@localhost:26257?sslcert=certs%2Fclient.root.crt&sslkey=certs%2Fclient.root.key&sslmode=verify-full&sslrootcert=certs%2Fca.crt'
```
The query metrics will appear on the dashboard:
 ## Step 6. Add monitoring and alerting
Follow the steps in the [Datadog documentation](https://docs.datadoghq.com/monitors/monitor_types/) to create a new Monitor.
Select **Threshold Alert** as the detection method. You can use this option to configure an alert that is sent when a [supported metric](https://docs.datadoghq.com/integrations/cockroachdb/?tab=host#data-collected) reaches a given threshold. For descriptions of some useful CockroachDB alerts, see Monitoring and Alerting.
The example alert below will trigger when a node has less than 15% of storage capacity remaining:
## Step 6. Add monitoring and alerting
Follow the steps in the [Datadog documentation](https://docs.datadoghq.com/monitors/monitor_types/) to create a new Monitor.
Select **Threshold Alert** as the detection method. You can use this option to configure an alert that is sent when a [supported metric](https://docs.datadoghq.com/integrations/cockroachdb/?tab=host#data-collected) reaches a given threshold. For descriptions of some useful CockroachDB alerts, see Monitoring and Alerting.
The example alert below will trigger when a node has less than 15% of storage capacity remaining:
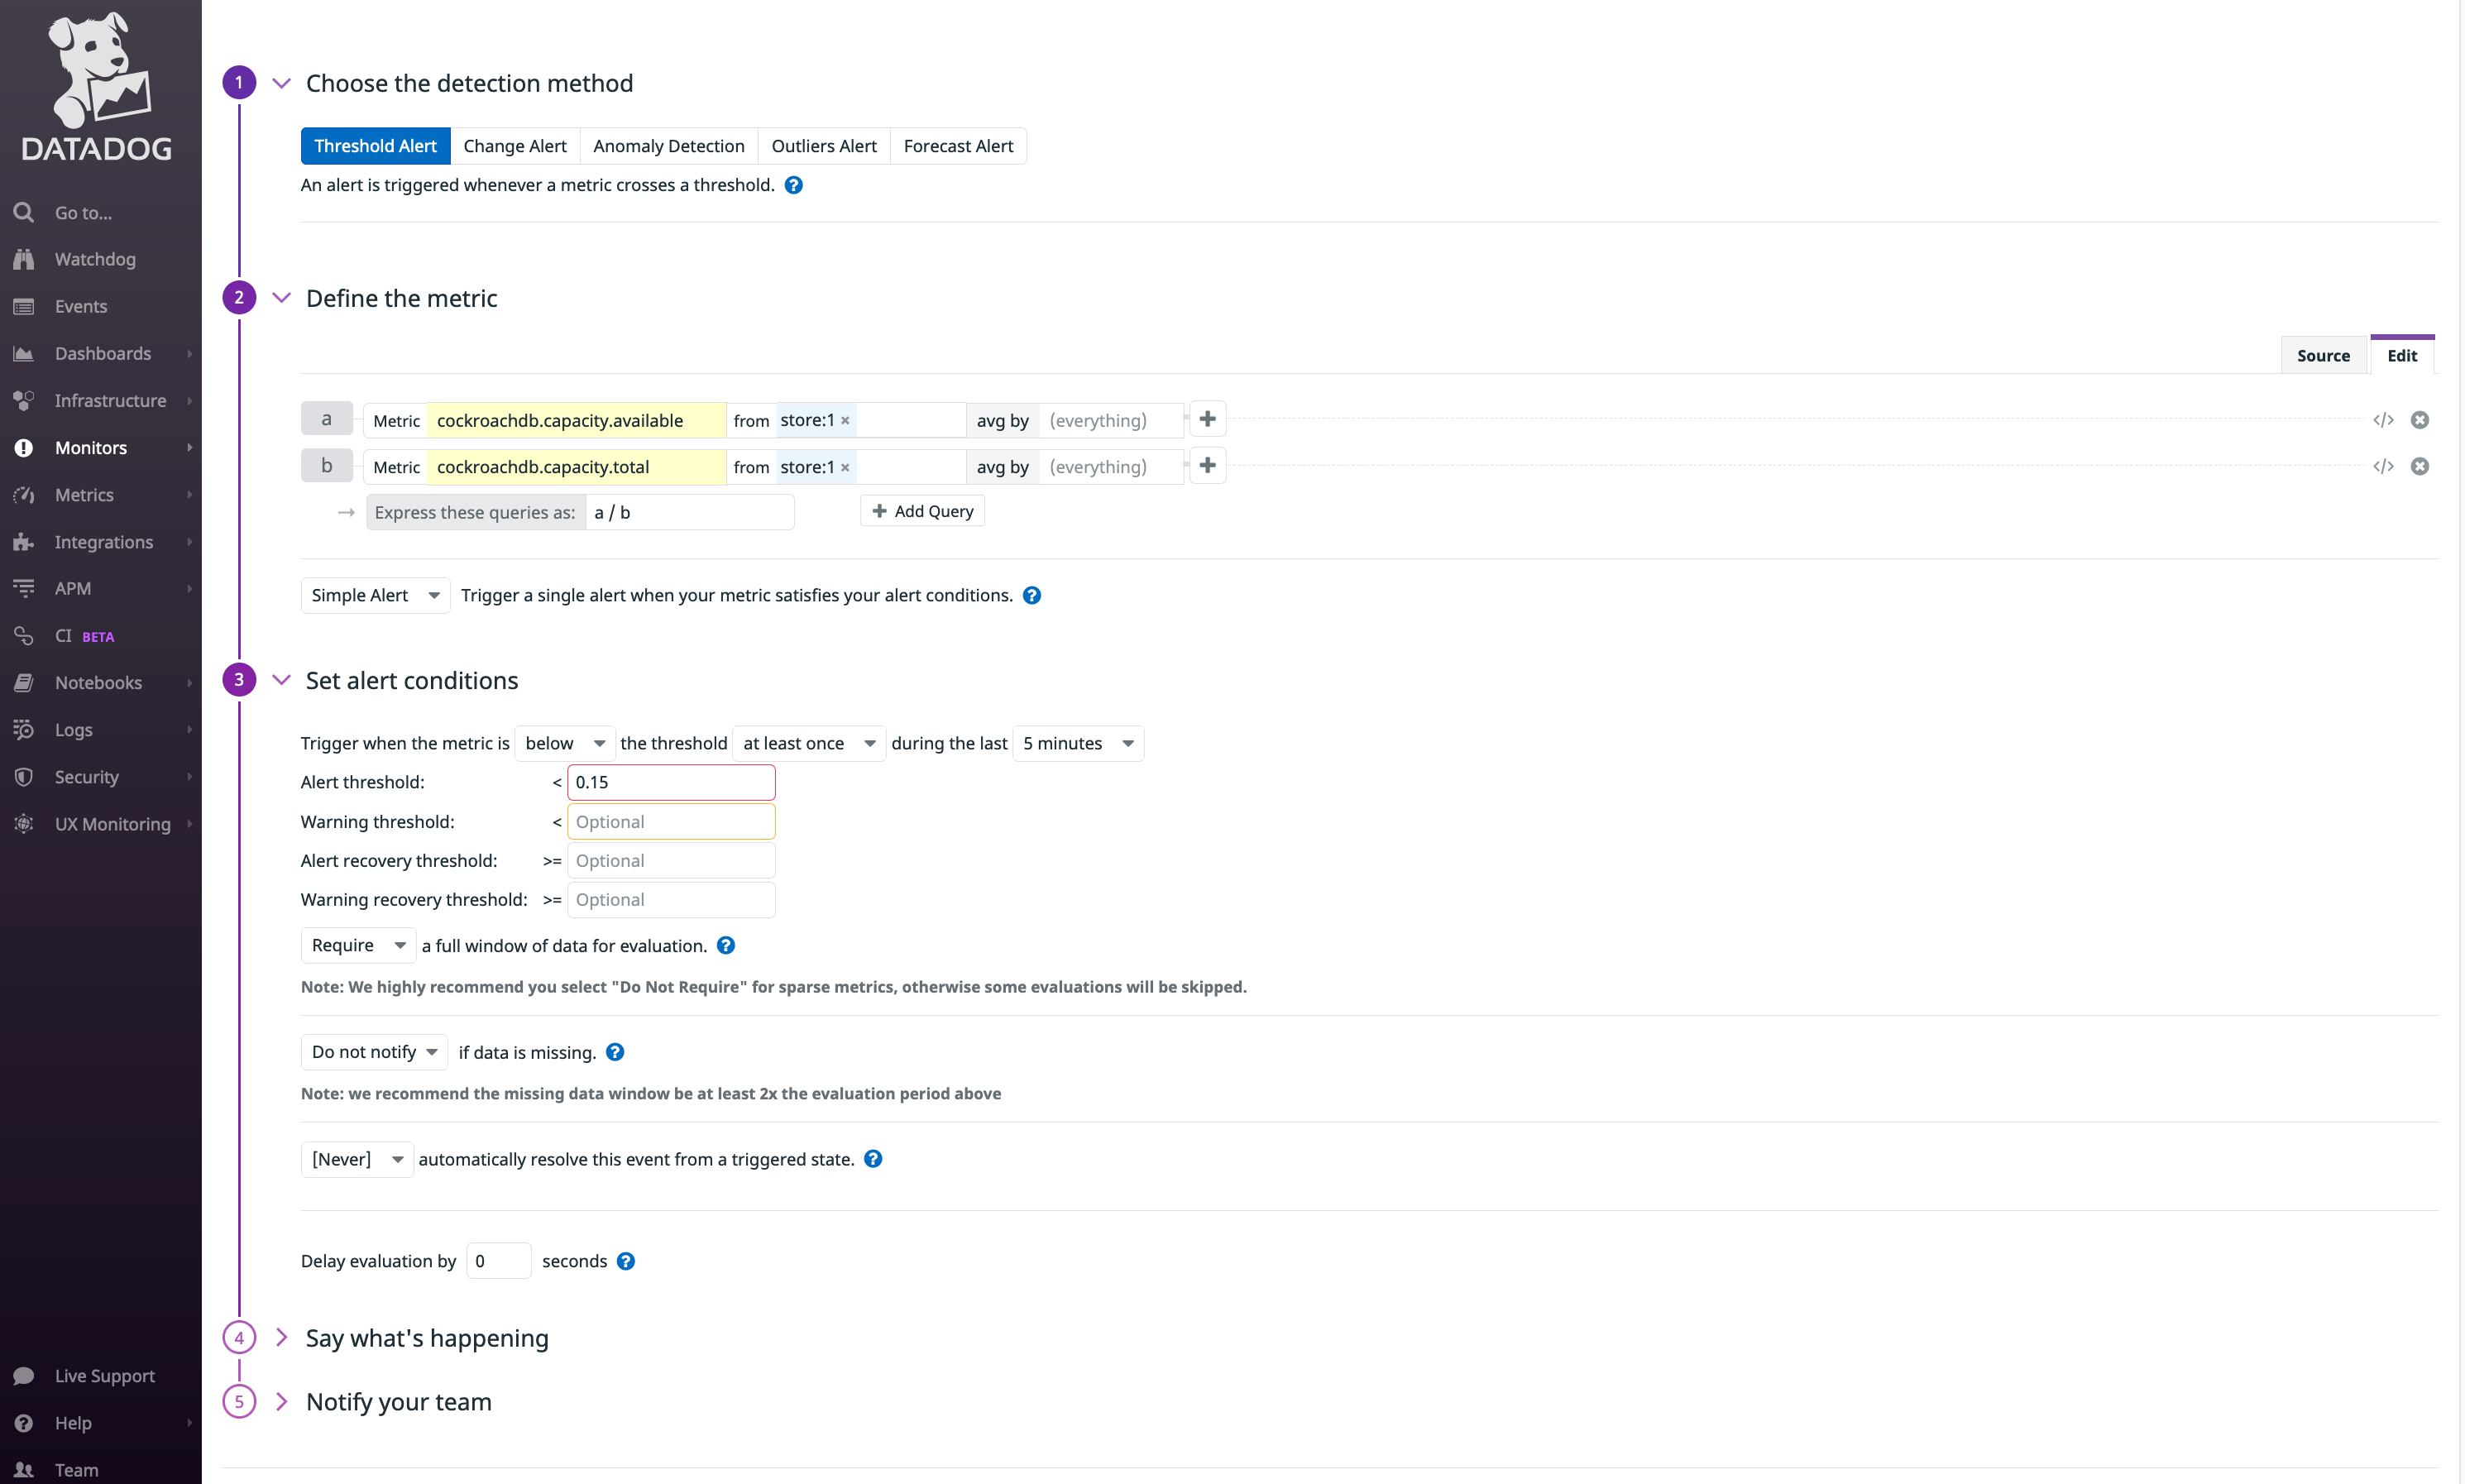 * `cockroachdb.capacity.available` is divided by `cockroachdb.capacity.total` to determine the fraction of available capacity on the node's store (the directory on each node where CockroachDB reads and writes its data).
* The alert threshold is set to `0.15`.
The timeseries graph at the top of the page indicates the configured metric and threshold:
* `cockroachdb.capacity.available` is divided by `cockroachdb.capacity.total` to determine the fraction of available capacity on the node's store (the directory on each node where CockroachDB reads and writes its data).
* The alert threshold is set to `0.15`.
The timeseries graph at the top of the page indicates the configured metric and threshold:
 ## Known limitations
* The integration of your CockroachDB self-hosted cluster with Datadog only supports displaying cluster-wide averages of reported metrics. Filtering by a specific node is unsupported.
## See also
* Monitoring and Alerting
* DB Console Overview
* Logging Overview
* Metrics
## Known limitations
* The integration of your CockroachDB self-hosted cluster with Datadog only supports displaying cluster-wide averages of reported metrics. Filtering by a specific node is unsupported.
## See also
* Monitoring and Alerting
* DB Console Overview
* Logging Overview
* Metrics