> ## Documentation Index
> Fetch the complete documentation index at: https://cockroachlabs.mintlify.site/llms.txt
> Use this file to discover all available pages before exploring further.
# Custom Metrics Chart Page
export const InternalLink = ({version, path = "", children, ...props}) => {
let detectedVersion = version || "stable";
if (typeof window !== 'undefined' && !version) {
const match = window.location.pathname.match(/\/docs\/([^/]+)/);
if (match) {
detectedVersion = match[1];
}
}
const normalizedPath = path.startsWith("/") ? path.slice(1) : path;
return
{children}
;
};
export const version = "stable";
The **Custom Metrics Chart** page allows you to create custom charts showing the time-series data for an available metric or combination of metrics. To view this page, select a cluster from the **Clusters** page, and click **Metrics** in the **Monitoring** section of the left side navigation. Navigate to the **Custom** tab.
**This feature is in preview** and subject to change. To share feedback and/or issues, contact [Support](https://support.cockroachlabs.com).
## Use the Custom Metrics Chart page
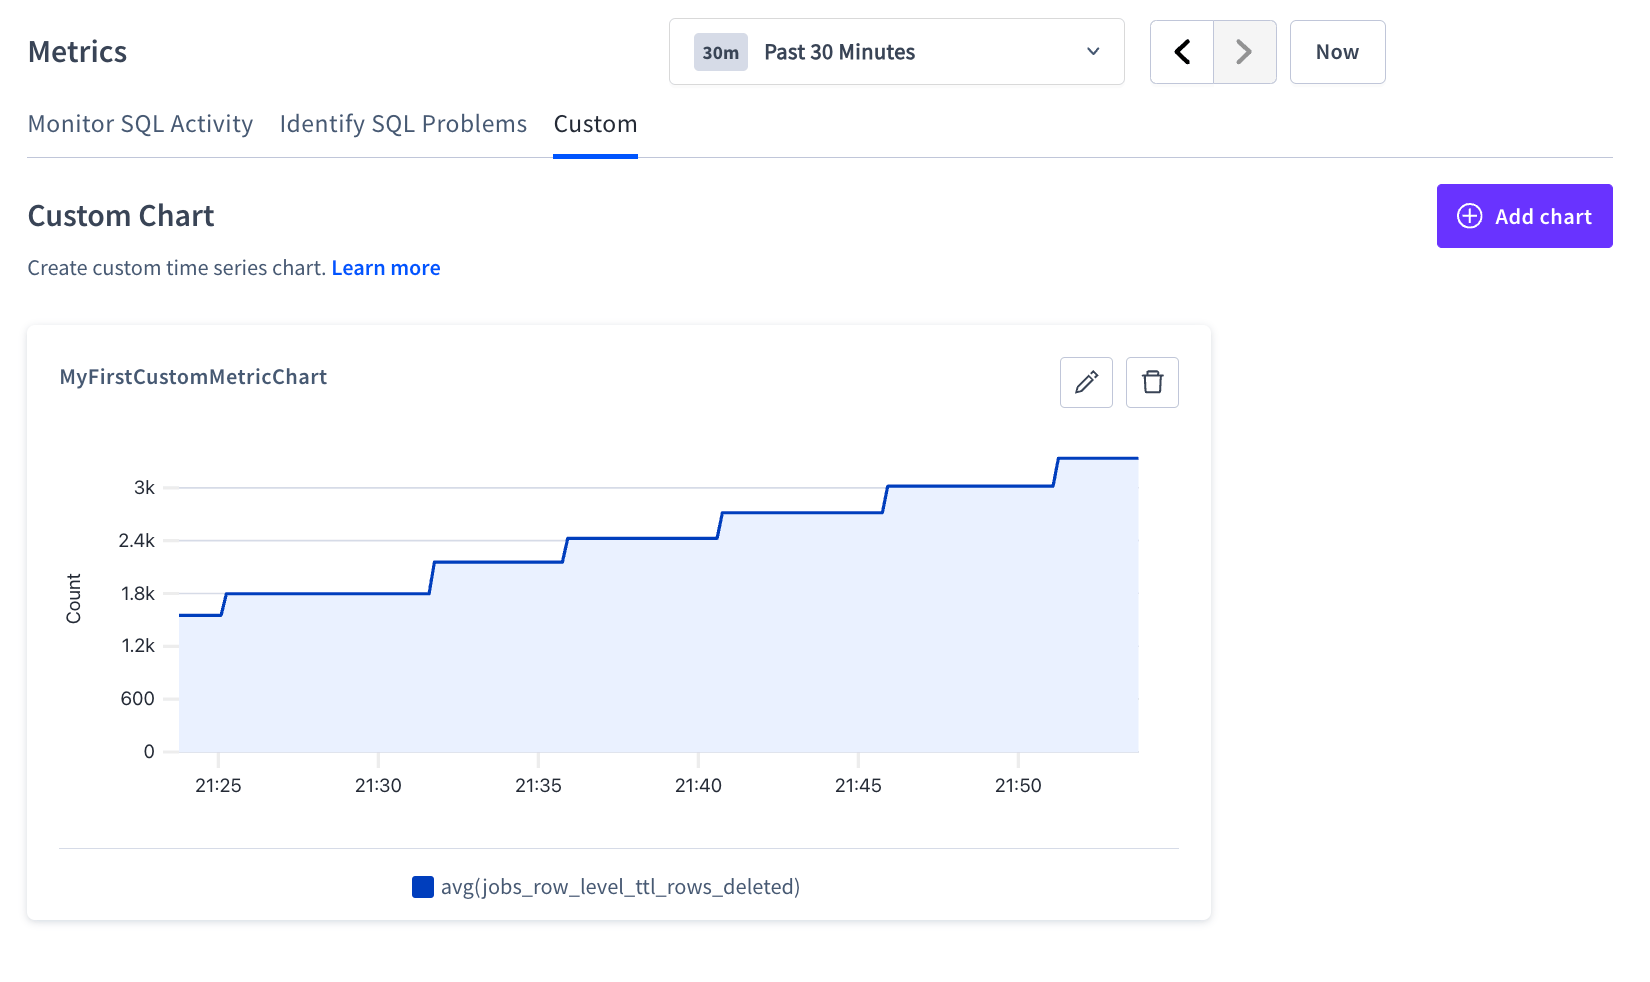 On the **Custom Metrics Chart** page, you can set the time range for all charts, add new custom charts, and edit or remove existing charts:
* To set the time range for the page, use the time interval selector at the top right of the page to filter the view for a predefined or custom time interval. Use the navigation buttons to move to the previous, next, or current time interval. When you select a time interval, the same interval is selected for all charts on all tabs of the **Metrics** page.
* To add a chart, click **Create** to create the first custom chart or **Add Chart** to create subsequent custom charts. The [**Create custom chart** dialog](#create-custom-chart-dialog) is displayed.
* To edit a chart, click the pencil icon to display the [**Edit custom chart** dialog](#create-custom-chart-dialog).
* To delete a chart, click the trash icon.
## Create custom chart dialog
In the **Create custom chart** dialog, you can customize each chart.
On the **Custom Metrics Chart** page, you can set the time range for all charts, add new custom charts, and edit or remove existing charts:
* To set the time range for the page, use the time interval selector at the top right of the page to filter the view for a predefined or custom time interval. Use the navigation buttons to move to the previous, next, or current time interval. When you select a time interval, the same interval is selected for all charts on all tabs of the **Metrics** page.
* To add a chart, click **Create** to create the first custom chart or **Add Chart** to create subsequent custom charts. The [**Create custom chart** dialog](#create-custom-chart-dialog) is displayed.
* To edit a chart, click the pencil icon to display the [**Edit custom chart** dialog](#create-custom-chart-dialog).
* To delete a chart, click the trash icon.
## Create custom chart dialog
In the **Create custom chart** dialog, you can customize each chart.
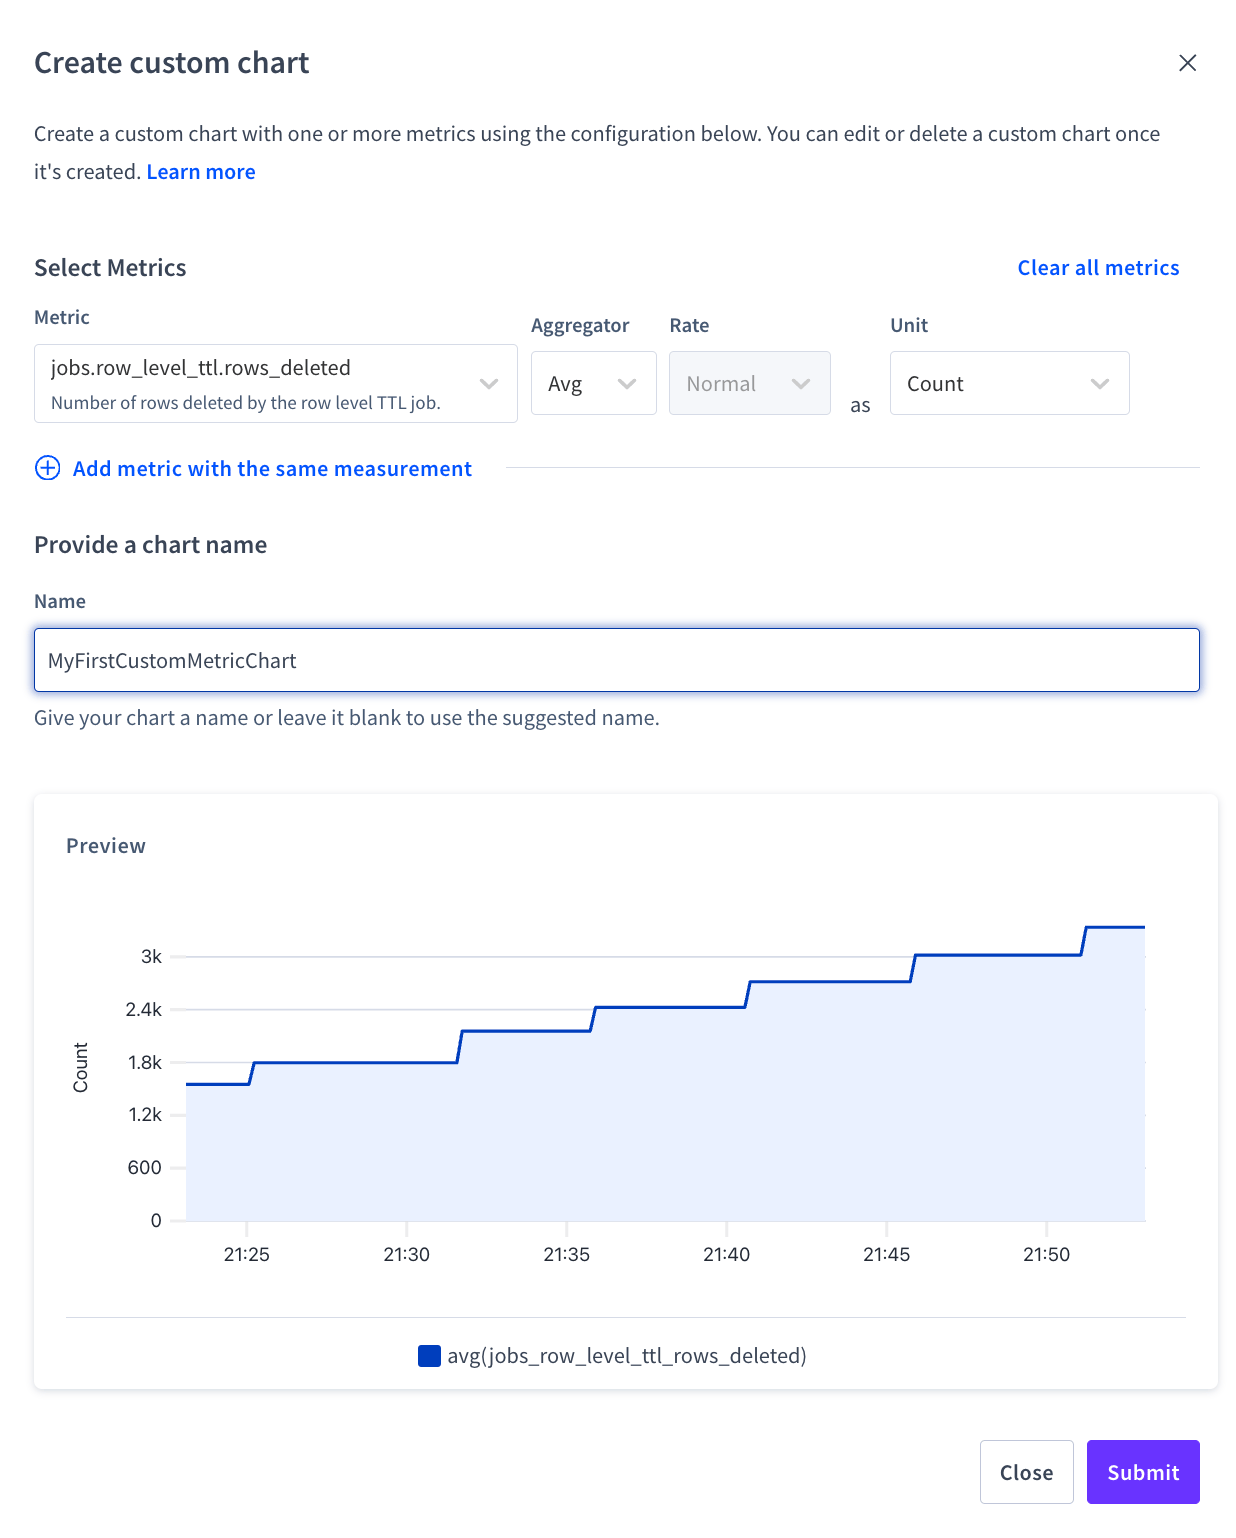 * Under **Select metrics**, add the metrics to be queried, and how they'll be combined and displayed. Options include:
| Column | Description |
| ---------- | --------------------------------------------------------------------------------------------------------------------------------------------------------------------------------------------------------------------------------------------------------------------------------------------------------------------------------------------------------------------------------------------------------------------------------------------------------------------------------------------------------------------------------------------------------------------------------------------------------------------------------------------------------------- |
| Metric | How the system refers to this metric, for example, `jobs.row\_level\_ttl.rows\_deleted`. **Note**: available metric options are filtered by **Units** selected. |
| Aggregator | Used to combine data points. Options:
* Under **Select metrics**, add the metrics to be queried, and how they'll be combined and displayed. Options include:
| Column | Description |
| ---------- | --------------------------------------------------------------------------------------------------------------------------------------------------------------------------------------------------------------------------------------------------------------------------------------------------------------------------------------------------------------------------------------------------------------------------------------------------------------------------------------------------------------------------------------------------------------------------------------------------------------------------------------------------------------- |
| Metric | How the system refers to this metric, for example, `jobs.row\_level\_ttl.rows\_deleted`. **Note**: available metric options are filtered by **Units** selected. |
| Aggregator | Used to combine data points. Options:- **Sum**: Returns the sum of all values seen.
- **Max**: Returns the highest value seen.
- **Min**: Returns the lowest value seen.
- **Avg**: Returns the average value over the time period.
|
| Rate | Determines how to display the rate of change during the selected time period. Option:- **Normal**: Returns the actual recorded value.
|
| Units | Sets the units to display. Options:- **Bytes**
- **Count**
- **Duration**
- **Percentage**
- **USD** Units can be selected in two ways: 1. Manually select a unit option. 2. When the first metric has been added - if no unit has been selected yet - the metric's unit will automatically be selected. Once a unit is selected, the available **Metric** options will be filtered to metrics with that unit type. For example, if the `Bytes` unit is selected, only metrics that are measured in `Bytes` will be available as **Metric** options. **Note**: Changing the unit will clear the selected metrics.
|
* To reset the dialog to a blank state - no metrics, aggregators or units set, click **Clear all metrics**.
* Under **Provide a chart name**, enter title text or keep default title with names of selected metrics.
* The **Preview** shows data, if available, for the selected metrics in the time range set by the **Metrics** page's time interval selector.
* Once the chart is verified in the **Preview**, click **Submit** to add the new custom chart or click **Close** to return to the existing **Custom Metrics Chart** page.
## Available metrics
The following is a list of available metrics for use in the Custom Metrics Chart page.
### Changefeed
| Name | Description |
| ------------------------------------- | ---------------------------------------------------------------------------------------------------------------------------------------------------------------------------------------------------------------------------------------------------------------------------------- |
| `changefeed.running` | Number of currently running changefeeds, including sinkless |
| `changefeed.failures` | Total number of `changefeed` jobs which have failed |
| `changefeed.error\_retries` | Total retryable errors encountered by all changefeeds |
| `changefeed.emitted\_messages` | Messages emitted by all feeds |
| `changefeed.emitted\_bytes` | Bytes emitted by all feeds |
| `changefeed.commit\_latency` | Event commit latency: a difference between event MVCC timestamp and the time it was acknowledged by the downstream sink. If the sink batches events, then the difference between the earliest event in the batch and acknowledgement is recorded; Excludes latency during backfill |
| `jobs.changefeed.currently\_paused` | Number of `changefeed` jobs currently considered Paused |
| `jobs.changefeed.protected\_age\_sec` | The age of the oldest PTS record protected by `changefeed` jobs. |
### Row-Level TTL
| Name | Description |
| --------------------------------------------------- | ------------------------------------------------------------------------- |
| `jobs.row\_level\_ttl.resume\_completed` | Number of `row\_level\_ttl` jobs which successfully resumed to completion |
| `jobs.row\_level\_ttl.resume\_failed` | Number of `row\_level\_ttl` jobs which failed with a non-retryable error |
| `jobs\_row\_level\_ttl.rows\_selected` | Number of rows selected for deletion by the row level TTL job. |
| `jobs.row\_level\_ttl.rows\_deleted` | Number of rows deleted by the row level TTL job. |
| `jobs.row\_level\_ttl.currently\_paused` | Number of `row\_level\_ttl` jobs currently considered Paused |
| `jobs.row\_level\_ttl.currently\_running` | Number of `row\_level\_ttl` jobs currently running |
| `schedules.scheduled-row-level-ttl-executor.failed` | Number of `scheduled-row-level-ttl-executor` jobs failed |
### Table Statistics
| Name | Description |
| --------------------------------------------- | ---------------------------------------------------------------------------- |
| `jobs.auto\_create\_stats.resume\_failed` | Number of `auto\_create\_stats` jobs which failed with a non-retryable error |
| `jobs.auto\_create\_stats.currently\_running` | Number of `auto\_create\_stats` jobs currently running |
| `jobs.auto\_create\_stats.currently\_paused` | Number of `auto\_create\_stats` jobs currently considered Paused |
| `jobs.create\_stats.currently\_running` | Number of `create\_stats` jobs currently running |
## See also
* Metrics Overview
* Essential Metrics for CockroachDB Standard Deployments
* Essential Metrics for CockroachDB Advanced Deployments